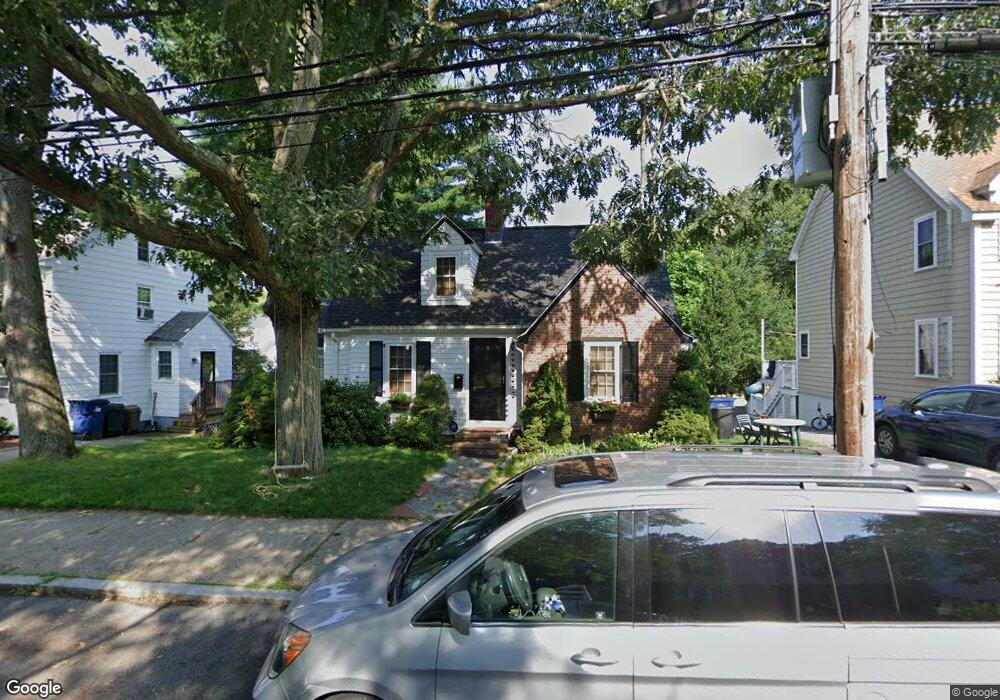
165 Hackensack Rd Chestnut Hill, MA 02467
West Roxbury NeighborhoodEstimated Value: $865,000 - $935,000
3
Beds
2
Baths
1,400
Sq Ft
$636/Sq Ft
Est. Value
About This Home
This home is located at 165 Hackensack Rd, Chestnut Hill, MA 02467 and is currently estimated at $889,898, approximately $635 per square foot. 165 Hackensack Rd is a home located in Suffolk County with nearby schools including Holy Name Parish School, St Theresa School, and Dexter School.
Ownership History
Date
Name
Owned For
Owner Type
Purchase Details
Closed on
Sep 23, 2015
Sold by
Doczi Jozsef
Bought by
Doczi Jozsef and Casey-Doczi Karan M
Current Estimated Value
Purchase Details
Closed on
Nov 21, 2011
Sold by
Monahan Susan
Bought by
Doczi Joczi
Home Financials for this Owner
Home Financials are based on the most recent Mortgage that was taken out on this home.
Original Mortgage
$384,012
Interest Rate
3.92%
Purchase Details
Closed on
May 13, 1991
Sold by
Vitello Vitello Ralph F Ralph F
Bought by
Monahan Susan M
Home Financials for this Owner
Home Financials are based on the most recent Mortgage that was taken out on this home.
Original Mortgage
$139,500
Interest Rate
9.41%
Mortgage Type
Purchase Money Mortgage
Create a Home Valuation Report for This Property
The Home Valuation Report is an in-depth analysis detailing your home's value as well as a comparison with similar homes in the area
Home Values in the Area
Average Home Value in this Area
Purchase History
| Date | Buyer | Sale Price | Title Company |
|---|---|---|---|
| Doczi Jozsef | -- | -- | |
| Doczi Joczi | $394,000 | -- | |
| Monahan Susan M | $155,000 | -- |
Source: Public Records
Mortgage History
| Date | Status | Borrower | Loan Amount |
|---|---|---|---|
| Previous Owner | Doczi Joczi | $384,012 | |
| Previous Owner | Monahan Susan M | $139,500 |
Source: Public Records
Tax History
| Year | Tax Paid | Tax Assessment Tax Assessment Total Assessment is a certain percentage of the fair market value that is determined by local assessors to be the total taxable value of land and additions on the property. | Land | Improvement |
|---|---|---|---|---|
| 2025 | $8,660 | $747,800 | $260,200 | $487,600 |
| 2024 | $7,529 | $690,700 | $233,100 | $457,600 |
| 2023 | $6,997 | $651,500 | $219,900 | $431,600 |
| 2022 | $6,443 | $592,200 | $199,900 | $392,300 |
| 2021 | $6,075 | $569,400 | $192,200 | $377,200 |
| 2020 | $5,859 | $554,800 | $173,200 | $381,600 |
| 2019 | $5,464 | $518,400 | $144,000 | $374,400 |
| 2018 | $5,225 | $498,600 | $144,000 | $354,600 |
| 2017 | $5,226 | $493,500 | $144,000 | $349,500 |
| 2016 | $5,073 | $461,200 | $144,000 | $317,200 |
| 2015 | $5,103 | $421,400 | $162,700 | $258,700 |
| 2014 | $5,001 | $397,500 | $162,700 | $234,800 |
Source: Public Records
Map
Nearby Homes
- 67 Risley Rd
- 37 Morey Rd
- 206 Allandale Rd Unit 3C
- 214 Allandale Rd Unit B
- 87 Buchanan Rd
- 170 Bonad Rd
- 227 Bonad Rd
- 1401 Centre St Unit 1401
- 91 Grove St
- 96 Theodore Parker Rd
- 104 Greaton Rd
- 36 Goodnough Rd
- 62 Ainsworth St
- 55 Bellingham Rd
- 10 Hallwood Rd
- 32 Russett Rd
- 72 Wallis Rd
- 72-74 Manthorne Rd Unit 74
- 17 Fairgreen Place
- 55 Redlands Rd
- 169 Hackensack Rd
- 161 Hackensack Rd
- 162 Payson Rd
- 173 Hackensack Rd
- 153 Hackensack Rd
- 158 Hackensack Rd
- 158 Hackensack Rd
- 177 Hackensack Rd
- 154 Hackensack Rd
- 150 Hackensack Rd
- 166 Payson Rd
- 146 Hackensack Rd
- 162 Hackensack Rd
- 149 Hackensack Rd
- 166 Hackensack Rd
- 170 Hackensack Rd
- 158 Payson Rd
- 181 Hackensack Rd
- 174 Payson Rd
- 144 Hackensack Rd
Your Personal Tour Guide
Ask me questions while you tour the home.