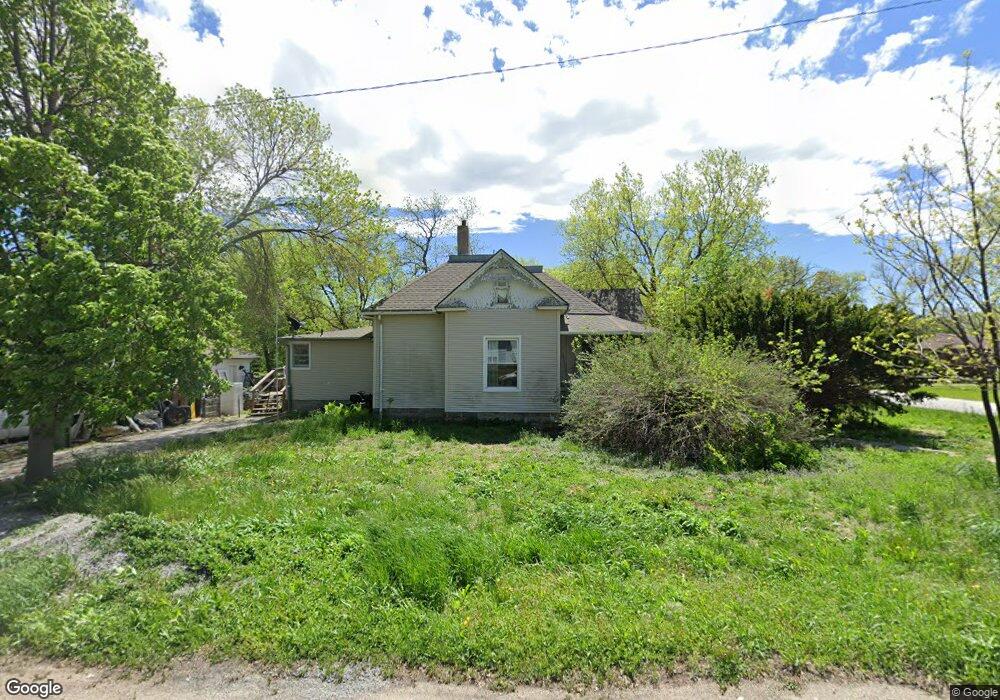
165 Hector St Cordova, NE 68330
Estimated Value: $64,000 - $174,000
2
Beds
1
Bath
1,534
Sq Ft
$77/Sq Ft
Est. Value
About This Home
This home is located at 165 Hector St, Cordova, NE 68330 and is currently estimated at $118,446, approximately $77 per square foot. 165 Hector St is a home with nearby schools including Friend Elementary School and Friend High School.
Ownership History
Date
Name
Owned For
Owner Type
Purchase Details
Closed on
Dec 14, 2016
Sold by
Take Flight Investments Llc
Bought by
Itzen Edward and Itzen Kathleen
Current Estimated Value
Home Financials for this Owner
Home Financials are based on the most recent Mortgage that was taken out on this home.
Original Mortgage
$34,000
Interest Rate
3.54%
Mortgage Type
Future Advance Clause Open End Mortgage
Purchase Details
Closed on
Jul 7, 2014
Sold by
Morris Troy and Morris Julie
Bought by
Take Flight Investments Llc
Create a Home Valuation Report for This Property
The Home Valuation Report is an in-depth analysis detailing your home's value as well as a comparison with similar homes in the area
Home Values in the Area
Average Home Value in this Area
Purchase History
| Date | Buyer | Sale Price | Title Company |
|---|---|---|---|
| Itzen Edward | $34,000 | Title Services | |
| Take Flight Investments Llc | -- | None Available |
Source: Public Records
Mortgage History
| Date | Status | Borrower | Loan Amount |
|---|---|---|---|
| Closed | Itzen Edward | $34,000 |
Source: Public Records
Tax History Compared to Growth
Tax History
| Year | Tax Paid | Tax Assessment Tax Assessment Total Assessment is a certain percentage of the fair market value that is determined by local assessors to be the total taxable value of land and additions on the property. | Land | Improvement |
|---|---|---|---|---|
| 2025 | -- | $48,028 | $12,218 | $35,810 |
| 2024 | $626 | $48,028 | $12,218 | $35,810 |
| 2023 | $626 | $48,028 | $12,218 | $35,810 |
| 2022 | $659 | $48,028 | $12,218 | $35,810 |
| 2021 | $675 | $48,809 | $10,345 | $38,464 |
| 2020 | $691 | $48,809 | $10,345 | $38,464 |
| 2019 | $682 | $48,809 | $10,345 | $38,464 |
| 2018 | $681 | $48,809 | $10,345 | $38,464 |
| 2017 | $623 | $52,704 | $14,240 | $38,464 |
| 2016 | $752 | $52,704 | $14,240 | $38,464 |
| 2015 | $770 | $48,591 | $8,510 | $40,081 |
| 2013 | $833 | $48,591 | $8,510 | $40,081 |
Source: Public Records
Map
Nearby Homes