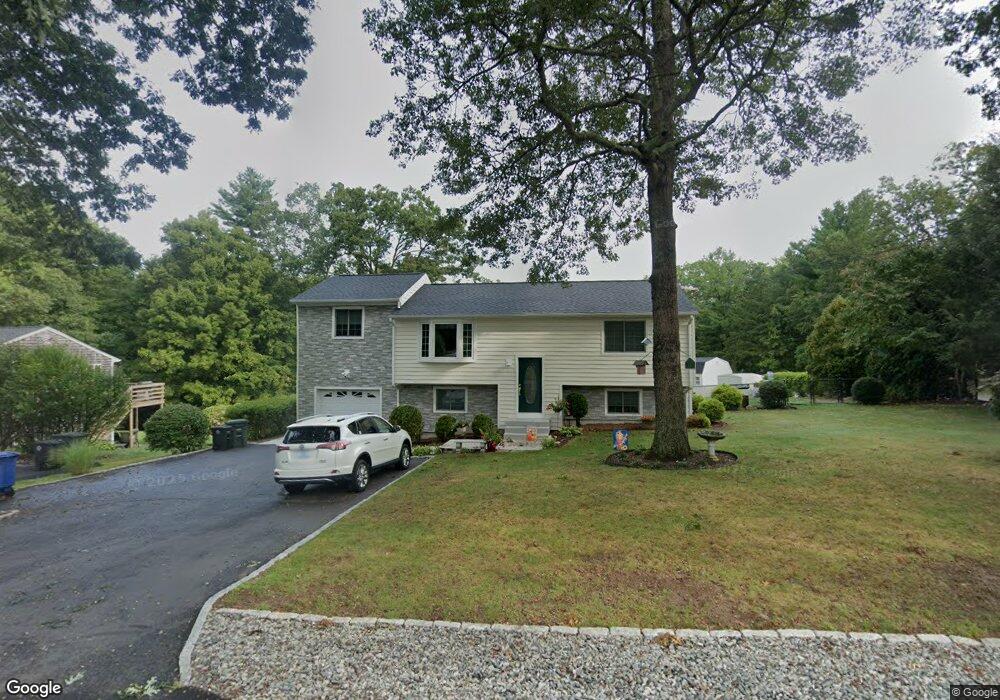
165 Howard Ave Coventry, RI 02816
Estimated Value: $413,000 - $479,529
3
Beds
1
Bath
1,500
Sq Ft
$300/Sq Ft
Est. Value
About This Home
This home is located at 165 Howard Ave, Coventry, RI 02816 and is currently estimated at $449,382, approximately $299 per square foot. 165 Howard Ave is a home located in Kent County with nearby schools including Alan Shawn Feinstein Ms Of Cov, Coventry High School, and St Joseph School.
Ownership History
Date
Name
Owned For
Owner Type
Purchase Details
Closed on
Sep 3, 2004
Sold by
Roche Marguerite and Roche Marguerite P
Bought by
Locke Robert W and Hunt Rosa
Current Estimated Value
Home Financials for this Owner
Home Financials are based on the most recent Mortgage that was taken out on this home.
Original Mortgage
$229,500
Outstanding Balance
$113,075
Interest Rate
6.01%
Mortgage Type
Purchase Money Mortgage
Estimated Equity
$336,307
Purchase Details
Closed on
Nov 1, 2001
Sold by
Littlefield Valerie M
Bought by
Roche Marguerite and Roche Marguerite P
Home Financials for this Owner
Home Financials are based on the most recent Mortgage that was taken out on this home.
Original Mortgage
$127,798
Interest Rate
6.82%
Create a Home Valuation Report for This Property
The Home Valuation Report is an in-depth analysis detailing your home's value as well as a comparison with similar homes in the area
Purchase History
| Date | Buyer | Sale Price | Title Company |
|---|---|---|---|
| Locke Robert W | $255,000 | -- | |
| Roche Marguerite | $140,000 | -- |
Source: Public Records
Mortgage History
| Date | Status | Borrower | Loan Amount |
|---|---|---|---|
| Closed | Roche Marguerite | $30,000 | |
| Closed | Roche Marguerite | $40,000 | |
| Open | Roche Marguerite | $229,500 | |
| Previous Owner | Roche Marguerite | $127,798 |
Source: Public Records
Tax History
| Year | Tax Paid | Tax Assessment Tax Assessment Total Assessment is a certain percentage of the fair market value that is determined by local assessors to be the total taxable value of land and additions on the property. | Land | Improvement |
|---|---|---|---|---|
| 2025 | $5,297 | $329,200 | $98,400 | $230,800 |
| 2024 | $5,219 | $329,500 | $98,400 | $231,100 |
| 2023 | $5,051 | $329,500 | $98,400 | $231,100 |
| 2022 | $5,104 | $260,800 | $96,200 | $164,600 |
| 2021 | $5,060 | $260,800 | $96,200 | $164,600 |
| 2020 | $5,800 | $260,800 | $96,200 | $164,600 |
| 2019 | $4,715 | $212,000 | $69,400 | $142,600 |
| 2018 | $4,581 | $212,000 | $69,400 | $142,600 |
| 2017 | $4,448 | $212,000 | $69,400 | $142,600 |
| 2016 | $4,310 | $201,300 | $68,300 | $133,000 |
| 2015 | $4,120 | $197,800 | $68,300 | $129,500 |
| 2014 | $3,851 | $201,300 | $68,300 | $133,000 |
| 2013 | $4,234 | $226,900 | $91,500 | $135,400 |
Source: Public Records
Map
Nearby Homes
- 0 Main St Unit 1399420
- 20 Howard Ave
- 22 Harris St Unit 24
- 0 Hill St
- 47 N Pleasant St
- 0 Main St
- 31 Brown St
- 111 Ayda Rose Ave
- 22 Douglas St
- 295 Main St
- 0 Bee St
- 32 Summit Ave
- 2 Sandalwood Ct
- 97 Ayda Rose Ave
- 402 Main St
- 99 Ayda Rose Ave
- 1340 Hope Rd
- 0 Chase Rd Unit 1365354
- 13 Bettez St
- 16 Hope Furnace Rd
Your Personal Tour Guide
Ask me questions while you tour the home.