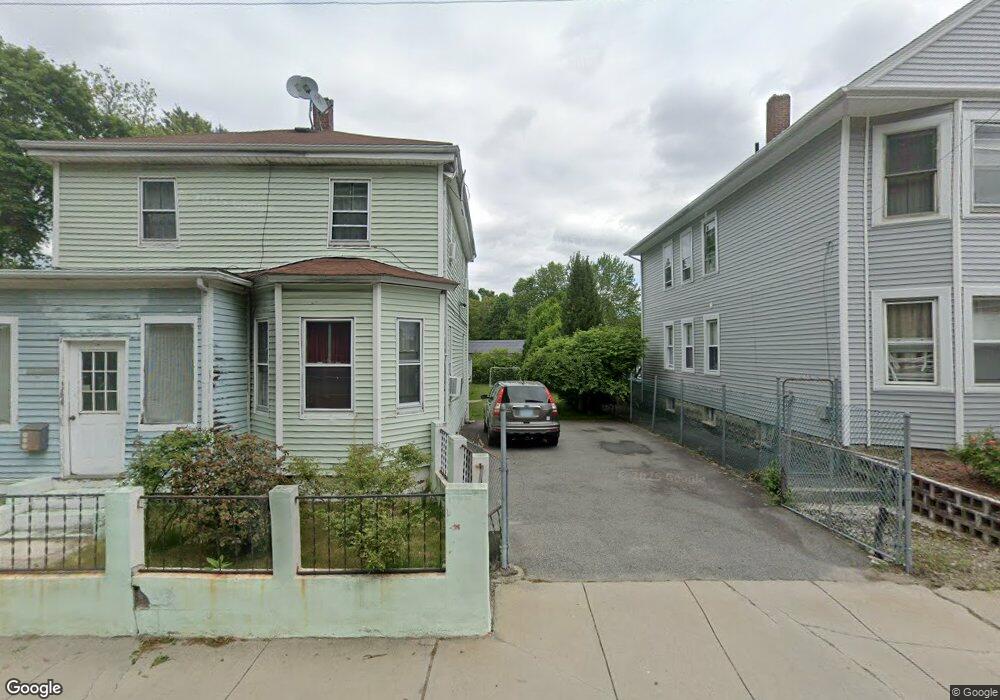
165 Killingly St Providence, RI 02909
Hartford NeighborhoodEstimated Value: $368,930 - $448,000
4
Beds
2
Baths
1,358
Sq Ft
$303/Sq Ft
Est. Value
About This Home
This home is located at 165 Killingly St, Providence, RI 02909 and is currently estimated at $411,733, approximately $303 per square foot. 165 Killingly St is a home located in Providence County with nearby schools including Achievement First Promesa, Achievement First Providence Mayoral Academy Elementary School, and Achievement First Providence Mayoral Academy Elementary.
Ownership History
Date
Name
Owned For
Owner Type
Purchase Details
Closed on
Mar 19, 2009
Sold by
Portillo Heidy and Madrid Jaire N
Bought by
Morales Rony and Ramirez Reyna
Current Estimated Value
Home Financials for this Owner
Home Financials are based on the most recent Mortgage that was taken out on this home.
Original Mortgage
$122,735
Outstanding Balance
$77,868
Interest Rate
5.25%
Mortgage Type
Purchase Money Mortgage
Estimated Equity
$333,865
Purchase Details
Closed on
Nov 28, 2006
Sold by
Franco Santos O and Franco Emilia
Bought by
Portillo Heidy
Home Financials for this Owner
Home Financials are based on the most recent Mortgage that was taken out on this home.
Original Mortgage
$210,000
Interest Rate
6.39%
Mortgage Type
Purchase Money Mortgage
Purchase Details
Closed on
Dec 14, 1988
Sold by
Mcdonald Louis
Bought by
Strang Robert
Create a Home Valuation Report for This Property
The Home Valuation Report is an in-depth analysis detailing your home's value as well as a comparison with similar homes in the area
Home Values in the Area
Average Home Value in this Area
Purchase History
| Date | Buyer | Sale Price | Title Company |
|---|---|---|---|
| Morales Rony | $125,000 | -- | |
| Portillo Heidy | $210,000 | -- | |
| Strang Robert | $50,000 | -- |
Source: Public Records
Mortgage History
| Date | Status | Borrower | Loan Amount |
|---|---|---|---|
| Open | Strang Robert | $122,735 | |
| Closed | Strang Robert | $2,500 | |
| Previous Owner | Strang Robert | $210,000 | |
| Previous Owner | Strang Robert | $154,275 |
Source: Public Records
Tax History
| Year | Tax Paid | Tax Assessment Tax Assessment Total Assessment is a certain percentage of the fair market value that is determined by local assessors to be the total taxable value of land and additions on the property. | Land | Improvement |
|---|---|---|---|---|
| 2025 | $2,780 | $330,900 | $138,100 | $192,800 |
| 2024 | $4,980 | $271,400 | $87,300 | $184,100 |
| 2023 | $4,980 | $271,400 | $87,300 | $184,100 |
| 2022 | $4,831 | $271,400 | $87,300 | $184,100 |
| 2021 | $3,974 | $161,800 | $51,800 | $110,000 |
| 2020 | $3,974 | $161,800 | $51,800 | $110,000 |
| 2019 | $3,974 | $161,800 | $51,800 | $110,000 |
| 2018 | $3,864 | $120,900 | $44,200 | $76,700 |
| 2017 | $3,864 | $120,900 | $44,200 | $76,700 |
| 2016 | $3,864 | $120,900 | $44,200 | $76,700 |
| 2015 | $3,906 | $118,000 | $44,200 | $73,800 |
| 2014 | $3,983 | $118,000 | $44,200 | $73,800 |
| 2013 | $3,983 | $118,000 | $44,200 | $73,800 |
Source: Public Records
Map
Nearby Homes
- 60 Ophelia St
- 10 Mott St
- 231 Lowell Ave
- 665 Plainfield St
- 166 Lowell Ave
- 102 Ophelia St
- 162 Merino St
- 0 Orchard St Unit 1396400
- 0 Orchard St Unit 1400488
- 15 Melissa St
- 18 Crowninshield St
- 240 Eastwood Ave
- 33 Harding Ave
- 29 Matson Ave Unit 35
- 140 Cleveland St
- 129 Glenbridge Ave
- 68 Murray St
- 173 Whittier Ave
- 649 Union Ave
- 33 Prudence Ave
- 159 Killingly St
- 154 Killingly St
- 169 Killingly St
- 173 Killingly St
- 155 Killingly St
- 15 Sunset Ave
- 177 Killingly St
- 35 Springfield St
- 40 Seton St
- 42 Seton St
- 185 Killingly St
- 38 Seton St
- 2 Ophelia St
- 189 Killingly St
- 35 Sunset Ave
- 12 Burchard St
- 12 Ophelia St
- 15 Springfield St
- 4 Ophelia St
- 208 Killingly St
Your Personal Tour Guide
Ask me questions while you tour the home.