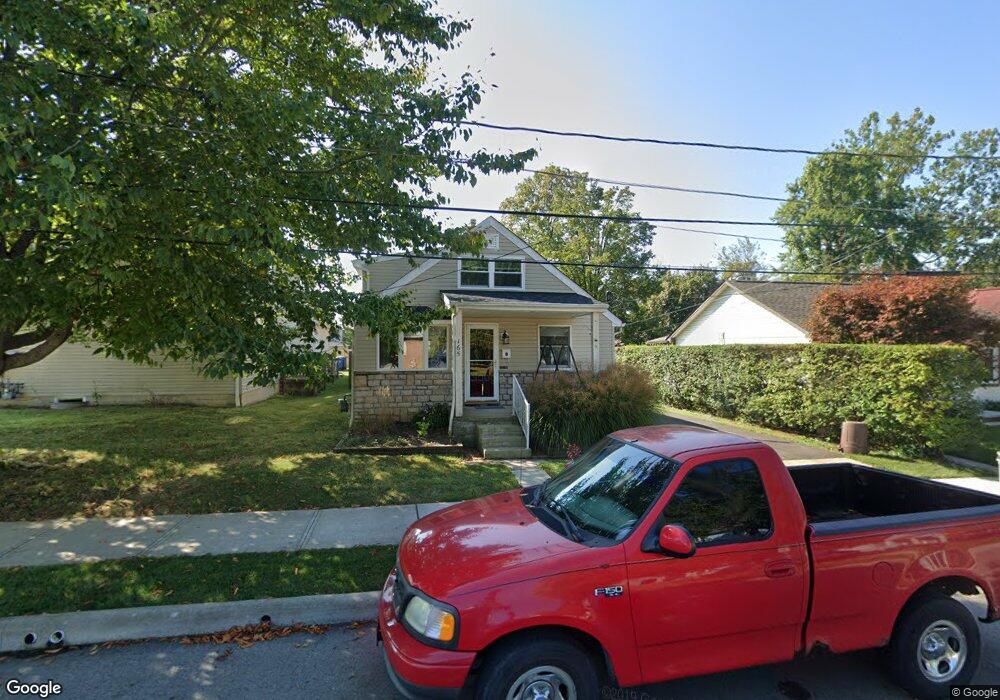
165 Logan Ave Westerville, OH 43081
Estimated Value: $279,000 - $328,000
3
Beds
1
Bath
1,120
Sq Ft
$279/Sq Ft
Est. Value
About This Home
This home is located at 165 Logan Ave, Westerville, OH 43081 and is currently estimated at $312,180, approximately $278 per square foot. 165 Logan Ave is a home located in Franklin County with nearby schools including Whittier Elementary School, Blendon Middle School, and Westerville South High School.
Ownership History
Date
Name
Owned For
Owner Type
Purchase Details
Closed on
Jun 18, 2004
Sold by
Dietz Linkhorn Warren T and Dietz Linkhorn Sharon
Bought by
Bruhn Michael B and Bruhn Janet M
Current Estimated Value
Home Financials for this Owner
Home Financials are based on the most recent Mortgage that was taken out on this home.
Original Mortgage
$128,000
Outstanding Balance
$64,201
Interest Rate
6.39%
Mortgage Type
Purchase Money Mortgage
Estimated Equity
$247,979
Purchase Details
Closed on
Mar 20, 1998
Sold by
Linkhorn Lloyd S and Linkhorn Linda M
Bought by
Linkhorn Warren T
Purchase Details
Closed on
Aug 28, 1997
Sold by
Schybal Joseph and Schybal Beverly June
Bought by
Linkhorn Lloyd S and Linkhorn Linda M
Home Financials for this Owner
Home Financials are based on the most recent Mortgage that was taken out on this home.
Original Mortgage
$62,400
Interest Rate
7.54%
Purchase Details
Closed on
Jan 21, 1993
Create a Home Valuation Report for This Property
The Home Valuation Report is an in-depth analysis detailing your home's value as well as a comparison with similar homes in the area
Home Values in the Area
Average Home Value in this Area
Purchase History
| Date | Buyer | Sale Price | Title Company |
|---|---|---|---|
| Bruhn Michael B | $128,000 | -- | |
| Linkhorn Warren T | $77,000 | Title Quest | |
| Linkhorn Lloyd S | $39,000 | Transohio Title | |
| -- | $54,900 | -- |
Source: Public Records
Mortgage History
| Date | Status | Borrower | Loan Amount |
|---|---|---|---|
| Open | Bruhn Michael B | $128,000 | |
| Previous Owner | Linkhorn Lloyd S | $62,400 |
Source: Public Records
Tax History Compared to Growth
Tax History
| Year | Tax Paid | Tax Assessment Tax Assessment Total Assessment is a certain percentage of the fair market value that is determined by local assessors to be the total taxable value of land and additions on the property. | Land | Improvement |
|---|---|---|---|---|
| 2024 | $4,526 | $79,630 | $26,740 | $52,890 |
| 2023 | $4,430 | $79,625 | $26,740 | $52,885 |
| 2022 | $4,331 | $59,440 | $15,580 | $43,860 |
| 2021 | $4,367 | $59,440 | $15,580 | $43,860 |
| 2020 | $4,354 | $59,440 | $15,580 | $43,860 |
| 2019 | $3,751 | $48,340 | $15,580 | $32,760 |
| 2018 | $3,732 | $48,340 | $15,580 | $32,760 |
| 2017 | $3,799 | $48,340 | $15,580 | $32,760 |
| 2016 | $3,909 | $46,620 | $13,720 | $32,900 |
| 2015 | $3,786 | $46,620 | $13,720 | $32,900 |
| 2014 | $3,788 | $46,620 | $13,720 | $32,900 |
| 2013 | $1,801 | $44,380 | $13,055 | $31,325 |
Source: Public Records
Map
Nearby Homes
- 92 N Vine St
- 160 N State St
- 389 Ridgemoor Ln
- 137 Abbeycross Ln
- 66 Abbeycross Ln
- 199 E College Ave
- 267 Windemere Place
- 53 W College Ave
- 364 E College Ave
- 543 N State St
- 79 W Park St
- 385 Hockberry Ave Unit Lot 1603
- 325 Vannette Ln Unit Lot 602
- 317 Vannette Ln Unit Lot 604
- 319 Vannette Ln Unit Lot 603
- 327 Vannette Ln Unit Lot 601
- Highwood Plan at Towns on the Greenway
- Halston with Loft Plan at Towns on the Greenway
- Halston Plan at Towns on the Greenway
- Highwood with Loft Plan at Towns on the Greenway
- 163 Logan Ave
- 167 Logan Ave Unit 169
- 167-169 Logan Ave
- 161 Logan Ave
- 155 Logan Ave Unit 157
- 168 Mossman Ave
- 164 Mossman Ave
- 164 Logan Ave
- 162 Logan Ave
- 151 Logan Ave
- 158 Logan Ave
- 160 Mossman Ave
- 170 Mossman Ave
- 154 Logan Ave
- 141 Logan Ave
- 150 Mossman Ave
- 150 Logan Ave
- 148 Mossman Ave
- 137 Logan Ave
- 140 Logan Ave