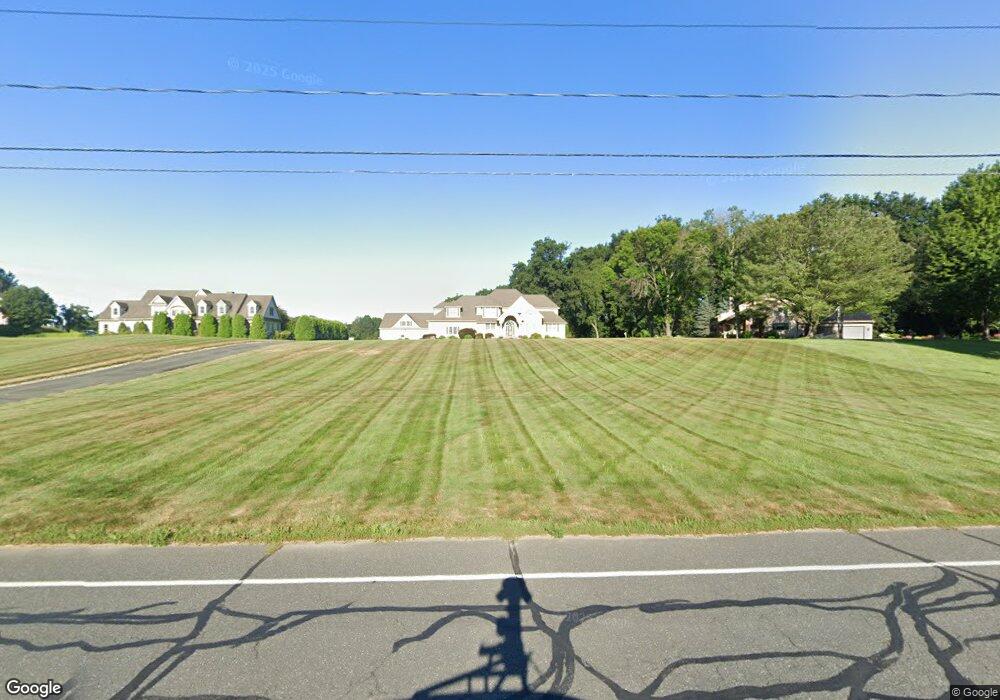
165 Main St Hatfield, MA 01038
Estimated Value: $786,000 - $1,179,000
3
Beds
2
Baths
4,810
Sq Ft
$208/Sq Ft
Est. Value
About This Home
This home is located at 165 Main St, Hatfield, MA 01038 and is currently estimated at $999,931, approximately $207 per square foot. 165 Main St is a home located in Hampshire County with nearby schools including Hatfield Elementary School and Smith Academy.
Ownership History
Date
Name
Owned For
Owner Type
Purchase Details
Closed on
Jan 4, 1996
Sold by
Lizek Harold B and Lizek Jeanette J
Bought by
Piziak Michael E and Wickles Carrie L
Current Estimated Value
Home Financials for this Owner
Home Financials are based on the most recent Mortgage that was taken out on this home.
Original Mortgage
$70,000
Interest Rate
7.34%
Mortgage Type
Purchase Money Mortgage
Create a Home Valuation Report for This Property
The Home Valuation Report is an in-depth analysis detailing your home's value as well as a comparison with similar homes in the area
Home Values in the Area
Average Home Value in this Area
Purchase History
| Date | Buyer | Sale Price | Title Company |
|---|---|---|---|
| Piziak Michael E | $80,000 | -- |
Source: Public Records
Mortgage History
| Date | Status | Borrower | Loan Amount |
|---|---|---|---|
| Open | Piziak Michael E | $354,000 | |
| Closed | Piziak Michael E | $365,000 | |
| Closed | Piziak Michael E | $370,000 | |
| Closed | Piziak Michael E | $70,000 |
Source: Public Records
Tax History
| Year | Tax Paid | Tax Assessment Tax Assessment Total Assessment is a certain percentage of the fair market value that is determined by local assessors to be the total taxable value of land and additions on the property. | Land | Improvement |
|---|---|---|---|---|
| 2025 | $14,961 | $1,081,000 | $234,100 | $846,900 |
| 2024 | $16,455 | $1,074,800 | $215,300 | $859,500 |
| 2023 | $13,027 | $966,400 | $203,400 | $763,000 |
| 2022 | $12,788 | $935,500 | $194,400 | $741,100 |
| 2021 | $12,865 | $906,600 | $176,400 | $730,200 |
| 2020 | $12,266 | $906,600 | $176,400 | $730,200 |
| 2019 | $12,065 | $868,600 | $165,100 | $703,500 |
| 2018 | $11,331 | $834,400 | $165,100 | $669,300 |
| 2017 | $10,912 | $825,400 | $165,100 | $660,300 |
| 2016 | $10,735 | $814,500 | $165,100 | $649,400 |
| 2015 | $10,599 | $804,800 | $158,400 | $646,400 |
| 2014 | $10,136 | $800,000 | $158,400 | $641,600 |
Source: Public Records
Map
Nearby Homes
- 0 Straits Rd
- 149 Prospect St
- 58 Main St Unit 4
- 58 Main St Unit 3
- 59 N Hatfield Rd
- 27 Prospect St
- 71 Chestnut St
- 18 Elm St
- 14 Hawley Rd
- 27 River Dr
- 121 Rocky Hill Rd
- Lot 3 Roosevelt St
- 3 Frost Ln
- 8 Aloha Dr
- 11 West St
- 6 E Commons Dr Unit 6
- 0 N Branch Rd
- 43 Laurel Park Unit 43
- 211 Russell St
- 79 State Rd
Your Personal Tour Guide
Ask me questions while you tour the home.