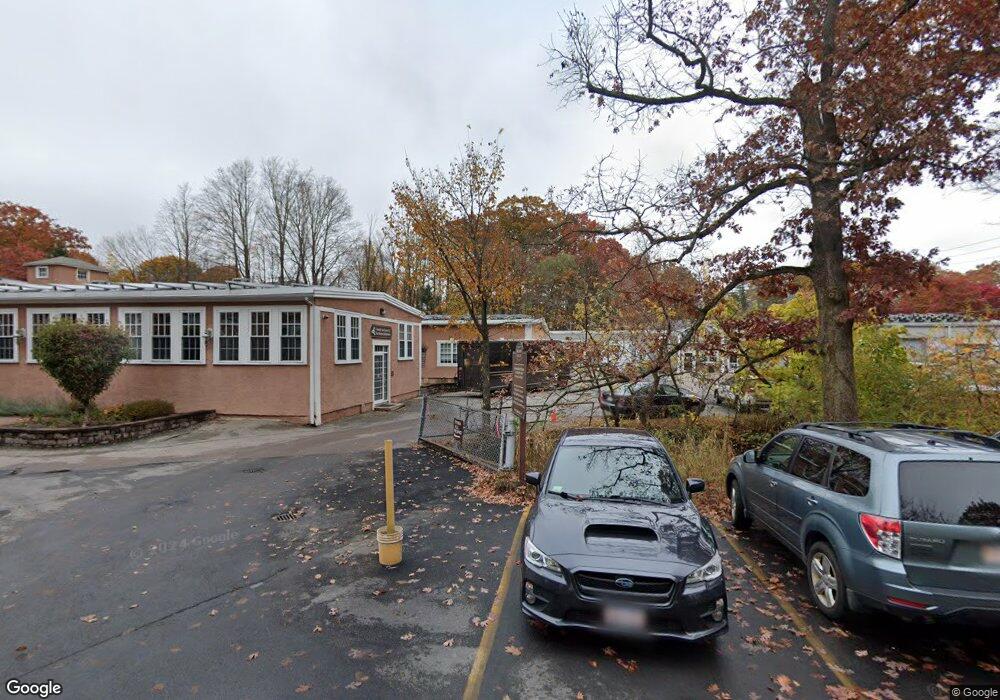
165 Main St Medway, MA 02053
Estimated Value: $2,916,663
--
Bed
2
Baths
7,150
Sq Ft
$408/Sq Ft
Est. Value
About This Home
This home is located at 165 Main St, Medway, MA 02053 and is currently estimated at $2,916,663, approximately $407 per square foot. 165 Main St is a home located in Norfolk County with nearby schools including John D. McGovern Elementary School, Burke-Memorial Elementary, and Medway Middle School.
Ownership History
Date
Name
Owned For
Owner Type
Purchase Details
Closed on
Jan 30, 2007
Sold by
Medway Mill Llc
Bought by
165 Main Street Rt
Current Estimated Value
Purchase Details
Closed on
Jul 1, 2003
Sold by
Chicken Brook Realty C
Bought by
Medway Mill Llc
Home Financials for this Owner
Home Financials are based on the most recent Mortgage that was taken out on this home.
Original Mortgage
$630,000
Interest Rate
5.53%
Mortgage Type
Purchase Money Mortgage
Create a Home Valuation Report for This Property
The Home Valuation Report is an in-depth analysis detailing your home's value as well as a comparison with similar homes in the area
Home Values in the Area
Average Home Value in this Area
Purchase History
| Date | Buyer | Sale Price | Title Company |
|---|---|---|---|
| 165 Main Street Rt | $1,465,000 | -- | |
| Medway Mill Llc | $900,000 | -- |
Source: Public Records
Mortgage History
| Date | Status | Borrower | Loan Amount |
|---|---|---|---|
| Previous Owner | Medway Mill Llc | $630,000 |
Source: Public Records
Tax History Compared to Growth
Tax History
| Year | Tax Paid | Tax Assessment Tax Assessment Total Assessment is a certain percentage of the fair market value that is determined by local assessors to be the total taxable value of land and additions on the property. | Land | Improvement |
|---|---|---|---|---|
| 2025 | $52,112 | $3,657,000 | $1,669,500 | $1,987,500 |
| 2024 | $52,661 | $3,657,000 | $1,669,500 | $1,987,500 |
| 2023 | $57,706 | $3,620,200 | $1,669,500 | $1,950,700 |
| 2022 | $55,332 | $3,268,300 | $1,492,400 | $1,775,900 |
| 2021 | $56,279 | $3,223,300 | $1,318,000 | $1,905,300 |
| 2020 | $50,551 | $2,888,600 | $936,800 | $1,951,800 |
| 2019 | $48,456 | $2,855,400 | $936,800 | $1,918,600 |
| 2018 | $46,539 | $2,635,300 | $936,800 | $1,698,500 |
| 2017 | $46,958 | $2,620,400 | $936,800 | $1,683,600 |
| 2016 | $43,354 | $2,393,900 | $1,033,700 | $1,360,200 |
| 2015 | $43,665 | $2,393,900 | $1,033,700 | $1,360,200 |
| 2014 | $44,502 | $2,362,100 | $1,059,300 | $1,302,800 |
Source: Public Records
Map
Nearby Homes
- 163 Main St Unit 6
- 159 Main St
- 999 Massachusetts 109
- 157 Main St
- 167 Main St
- 30 Norfolk Ave
- 160 Main St
- 31 Norfolk Ave
- 155 Main St
- 158 Main St
- 169 Main St
- 169 Main St Unit 101
- 44 Lincoln St
- 42 Lincoln St
- 168 Main St
- 40 Lincoln St
- 153 Main St Unit suite 2
- 153 Main St Unit 1A
- 153 Main St Unit Suite 1
- 153 Main St