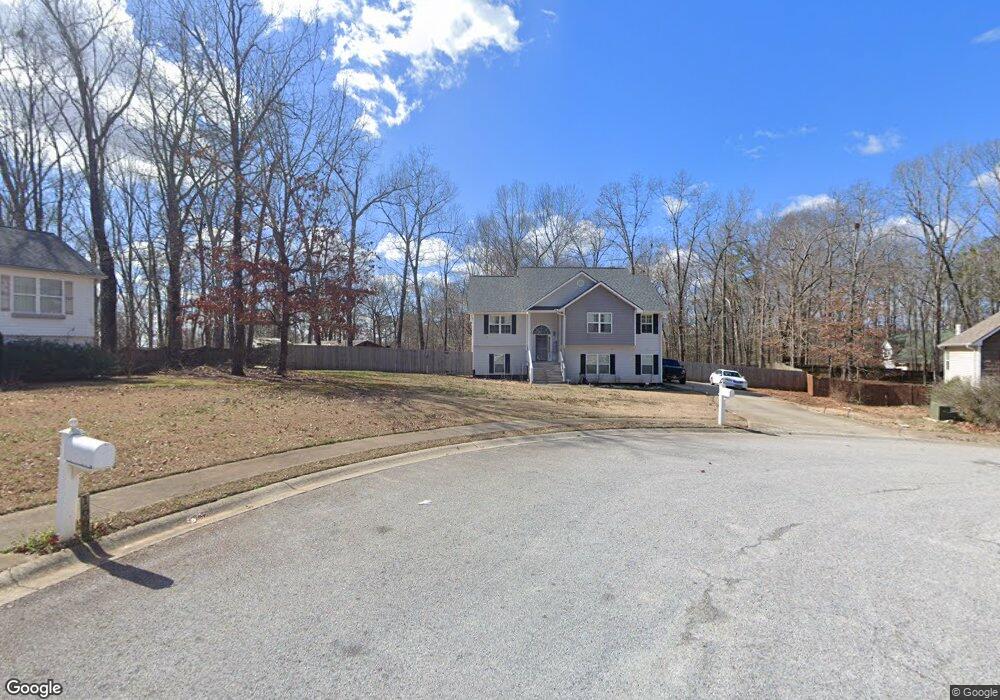
165 Morning View Dr Temple, GA 30179
Abilene NeighborhoodEstimated Value: $355,000 - $410,000
4
Beds
3
Baths
1,777
Sq Ft
$213/Sq Ft
Est. Value
About This Home
This home is located at 165 Morning View Dr, Temple, GA 30179 and is currently estimated at $378,984, approximately $213 per square foot. 165 Morning View Dr is a home located in Carroll County with nearby schools including Ithica Elementary School, Bay Springs Middle School, and Villa Rica High School.
Ownership History
Date
Name
Owned For
Owner Type
Purchase Details
Closed on
Dec 14, 2015
Sold by
Brown Michelle R
Bought by
Brown Johnny R
Current Estimated Value
Home Financials for this Owner
Home Financials are based on the most recent Mortgage that was taken out on this home.
Original Mortgage
$131,773
Outstanding Balance
$104,694
Interest Rate
4.01%
Mortgage Type
VA
Estimated Equity
$274,290
Purchase Details
Closed on
Jan 23, 2007
Sold by
W W Homebuilders Inc
Bought by
Brown Johnny R
Home Financials for this Owner
Home Financials are based on the most recent Mortgage that was taken out on this home.
Original Mortgage
$143,260
Interest Rate
6.14%
Mortgage Type
New Conventional
Purchase Details
Closed on
Aug 27, 2003
Sold by
Terry Fernander Const & Dev In
Bought by
W & W Homebuilders Inc
Purchase Details
Closed on
Jul 29, 2003
Bought by
Terry Fernander Const & Dev Inc
Create a Home Valuation Report for This Property
The Home Valuation Report is an in-depth analysis detailing your home's value as well as a comparison with similar homes in the area
Home Values in the Area
Average Home Value in this Area
Purchase History
| Date | Buyer | Sale Price | Title Company |
|---|---|---|---|
| Brown Johnny R | -- | -- | |
| Brown Johnny R | $181,247 | -- | |
| W & W Homebuilders Inc | $598,000 | -- | |
| Terry Fernander Const & Dev Inc | -- | -- |
Source: Public Records
Mortgage History
| Date | Status | Borrower | Loan Amount |
|---|---|---|---|
| Open | Brown Johnny R | $131,773 | |
| Previous Owner | Brown Johnny R | $143,260 |
Source: Public Records
Tax History Compared to Growth
Tax History
| Year | Tax Paid | Tax Assessment Tax Assessment Total Assessment is a certain percentage of the fair market value that is determined by local assessors to be the total taxable value of land and additions on the property. | Land | Improvement |
|---|---|---|---|---|
| 2024 | $2,411 | $135,661 | $10,000 | $125,661 |
| 2023 | $2,411 | $124,238 | $10,000 | $114,238 |
| 2022 | $2,024 | $101,684 | $10,000 | $91,684 |
| 2021 | $1,838 | $88,526 | $10,000 | $78,526 |
| 2020 | $1,687 | $80,095 | $10,000 | $70,095 |
| 2019 | $1,598 | $74,725 | $10,000 | $64,725 |
| 2018 | $1,432 | $64,762 | $10,000 | $54,762 |
| 2017 | $1,435 | $64,762 | $10,000 | $54,762 |
| 2016 | $1,436 | $64,762 | $10,000 | $54,762 |
| 2015 | $1,052 | $40,178 | $8,000 | $32,178 |
| 2014 | $1,056 | $40,178 | $8,000 | $32,178 |
Source: Public Records
Map
Nearby Homes
- 566 Clinton Dr
- 128 W Lakeview Dr
- 528 Clinton Dr
- 98 W Lakeview Dr
- 408 Reagan Dr
- 396 Lakeridge Dr
- 240 River Oak Ct
- 108 Villa Rosa Ridge
- 1580 Bar J Rd
- 0 Bar J Rd Unit 10578558
- 0 Bar J Rd Unit 7627694
- 1620 Bar J Rd Unit LOT 1 RIVER RIDGE /
- 68 Villa Rosa Dr
- 252 Spruill Bridge Rd Unit LOT 3 HAMILTON / LOF
- 341 Oak Shade Rd
- 0 Pleasant Oak Dr Unit 10610473
- 0 Pleasant Oak Dr Unit 148244
- 390 Bar J Rd
- 301 Spruill Bridge Rd
- 384 Double d Rd
- 161 Morning View Dr
- 161 Morning View Dr Unit 36
- 30 Edgewater Ct
- 166 Morning View Dr
- 157 Morning View Dr
- 23 Edgewater Ct Unit V/ LOT 23
- 128 W Oak Trail
- 162 Morning View Dr
- 153 Morning View Dr
- 153 Morning View Dr Unit 34
- 153 Morning View Dr
- 158 Morning View Dr
- 0 N Oak Trail
- 0 N Oak Trail Unit 4117229
- 154 Morning View Dr
- 149 Morning View Dr
- 150 Morning View Dr
- 225 Stonewood Ct
- 125 W Oak Trail
- 221 Stonewood Ct