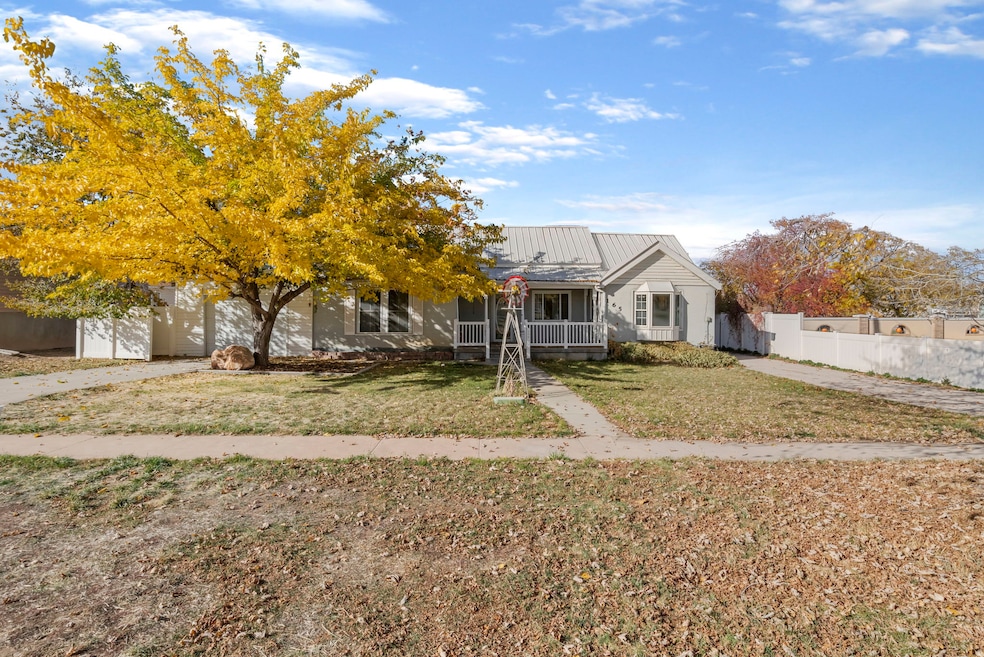
165 N 100 W Fillmore, UT 84631
Estimated payment $1,425/month
Highlights
- Horse Property
- Fruit Trees
- Rambler Architecture
- RV or Boat Parking
- Mountain View
- No HOA
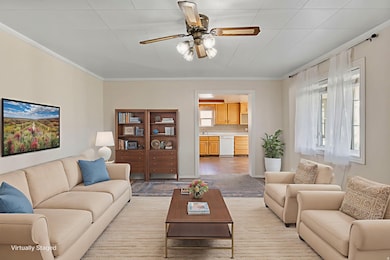
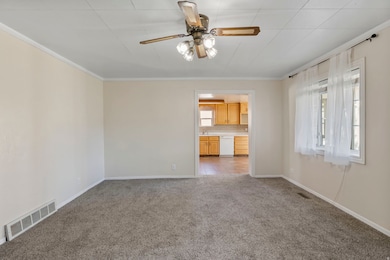
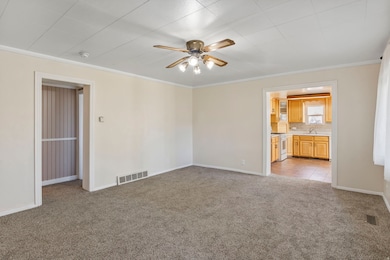
About This Home
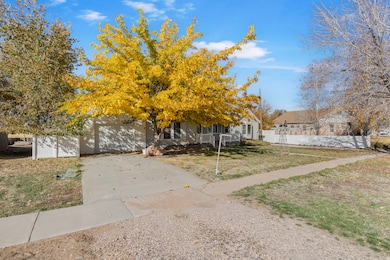
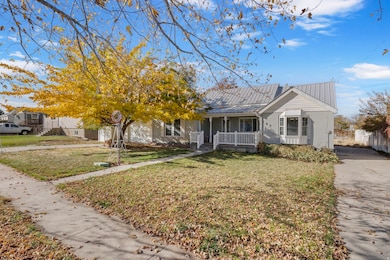
This charming and timeless residence is situated in the heart of Fillmore! Great sized home that offers 1561 sq. ft sits on a spacious 0.63-acre lot and features 3 bedrooms and 1 full bath, blending classic character with modern comfort. Step inside to discover freshly painted walls that brighten the whole place and brand-new carpeting (Installed Sept 2025) throughout the living areas and bedrooms, creating a warm and inviting feel. The kitchen was updated by previous owners, offering open sightlines to the sun-filled living spaces. Outside, the expansive yard provides plenty of room for gardening, RV parking, cute animals or future additions, along with an attached garage and ample parking. With a durable metal roof, this home is built to last. Ideally located near local schools and historic downtown Fillmore, this move-in-ready home perfectly combines small-town charm with modern updates and space to grow. Square footage figures are provided as a courtesy estimate only. Buyer is advised to obtain an independent measurement.

Home Details
Home Type
- Single Family
Est. Annual Taxes
- $1,283
Year Built
- Built in 1900
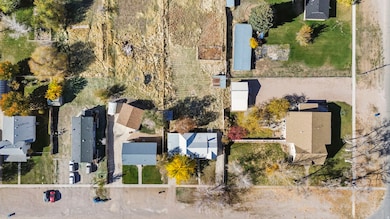
Lot Details
- 0.63 Acre Lot
- Partially Fenced Property
- Landscaped
- Sprinkler System
- Fruit Trees
- Mature Trees
- Property is zoned Single-Family
Parking
- 1 Car Attached Garage
- RV or Boat Parking
Home Design
- Rambler Architecture
- Metal Roof
- Stucco
Interior Spaces
- 1,561 Sq Ft Home
- 2-Story Property
- Mountain Views
- Partial Basement
- Portable Dishwasher
Flooring
- Carpet
- Tile
Bedrooms and Bathrooms
- 3 Main Level Bedrooms
- 1 Bathroom
Outdoor Features
- Horse Property
- Separate Outdoor Workshop
- Outbuilding
Schools
- Fillmore Elementary And Middle School
- Millard High School
Farming
- 1 Irrigated Acre
Utilities
- Forced Air Heating and Cooling System
- Natural Gas Connected
Community Details
- No Home Owners Association
- Fillmore Block 77 Subdivision
Listing and Financial Details
- Assessor Parcel Number F-417
Map
Home Values in the Area
Average Home Value in this Area
Tax History
| Year | Tax Paid | Tax Assessment Tax Assessment Total Assessment is a certain percentage of the fair market value that is determined by local assessors to be the total taxable value of land and additions on the property. | Land | Improvement |
|---|---|---|---|---|
| 2025 | $1,283 | $161,135 | $33,086 | $128,049 |
| 2024 | $1,283 | $120,318 | $25,596 | $94,722 |
| 2023 | $1,306 | $120,318 | $25,596 | $94,722 |
| 2022 | $1,106 | $99,271 | $23,269 | $76,002 |
| 2021 | $952 | $82,064 | $15,110 | $66,954 |
| 2020 | $873 | $75,717 | $13,736 | $61,981 |
| 2019 | $751 | $65,349 | $13,736 | $51,613 |
| 2018 | $718 | $63,894 | $13,736 | $50,158 |
| 2017 | $631 | $53,437 | $13,736 | $39,701 |
| 2016 | $604 | $53,437 | $13,736 | $39,701 |
| 2015 | $604 | $53,437 | $13,736 | $39,701 |
| 2014 | -- | $53,437 | $13,736 | $39,701 |
| 2013 | -- | $53,437 | $13,736 | $39,701 |
Property History
| Date | Event | Price | List to Sale | Price per Sq Ft |
|---|---|---|---|---|
| 11/08/2025 11/08/25 | For Sale | $250,000 | -- | $160 / Sq Ft |
Purchase History
| Date | Type | Sale Price | Title Company |
|---|---|---|---|
| Warranty Deed | -- | Juab Title | |
| Interfamily Deed Transfer | -- | First American Title | |
| Special Warranty Deed | -- | -- |
Mortgage History
| Date | Status | Loan Amount | Loan Type |
|---|---|---|---|
| Open | $169,696 | New Conventional |
Source: UtahRealEstate.com
MLS Number: 2121951
APN: F-417
Disclaimer: Certain information contained herein is derived from information provided by parties other than Homes.com. All information provided is deemed reliable, but is not guaranteed to be accurate and should be independently verified.
![]() IDX information is provided exclusively for consumers’ personal, non-commercial use, that it may not be used for any purpose other than to identify prospective properties consumers may be interested in purchasing, and that the data is deemed reliable but is not guaranteed accurate by the MLS. Licensor is only providing the MLS Content and not other sources of data provided in the Product.
IDX information is provided exclusively for consumers’ personal, non-commercial use, that it may not be used for any purpose other than to identify prospective properties consumers may be interested in purchasing, and that the data is deemed reliable but is not guaranteed accurate by the MLS. Licensor is only providing the MLS Content and not other sources of data provided in the Product.
Based on information from the Wasatch Front Regional Multiple Listing Service, Inc.. All data, including all measurements and calculations of area, is obtained from various sources and has not been, and will not be, verified by broker or the MLS. All information should be independently reviewed and verified for accuracy. Properties may or may not be listed by the office/agent presenting the information.
- 60 W 100 N
- 225 W 200 St N
- 390 N 100 W
- 380 N 200 St W
- 40 S 100 Rd E
- 335 W 400 North St
- 625 N 100 St E Unit 20
- 220 S 200 E
- 30 E 300 S
- 2600 S 400 Rd W
- 190 W 400 St S
- 310 S 500 West Rd
- 410 W 400 N
- 430 E Canyon Rd
- 155 E 500 St S
- 310 S 600 E
- 405 E 500 St S
- 690 E 500 S
- 760 E 700 St S
- 2155 N Cedar Mountain Rd