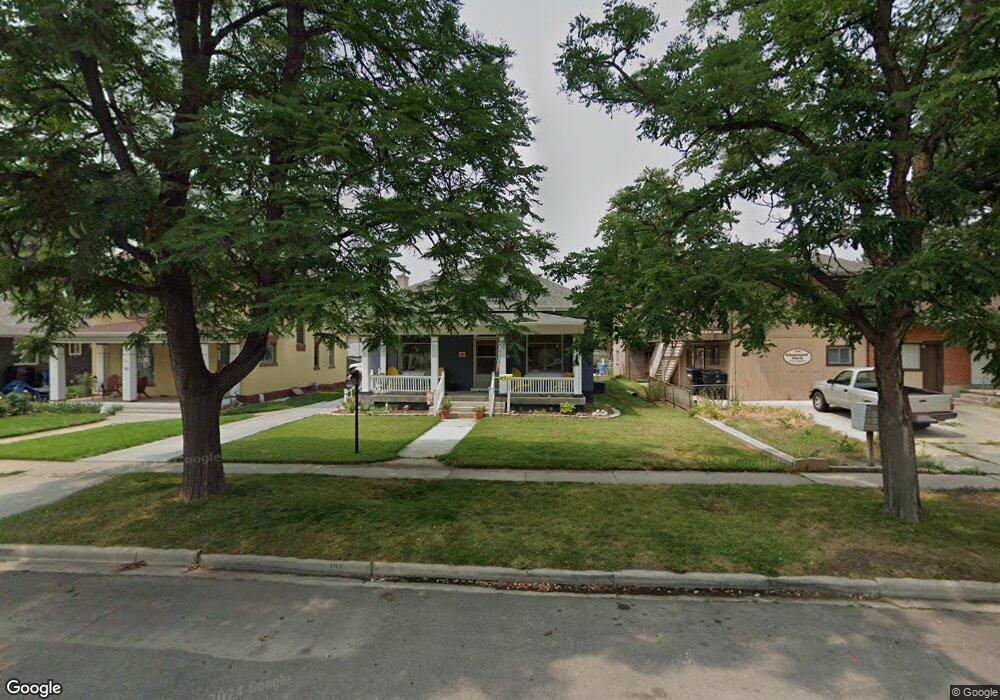
165 N 300 E Provo, UT 84606
Joaquin NeighborhoodEstimated Value: $515,000 - $572,000
4
Beds
2
Baths
1,506
Sq Ft
$353/Sq Ft
Est. Value
About This Home
This home is located at 165 N 300 E, Provo, UT 84606 and is currently estimated at $531,062, approximately $352 per square foot. 165 N 300 E is a home located in Utah County with nearby schools including Provo Peaks School, Centennial Middle School, and Timpview High School.
Ownership History
Date
Name
Owned For
Owner Type
Purchase Details
Closed on
May 10, 2004
Sold by
Lyman Alfred G
Bought by
Wall Oran L and Wall Shawna O
Current Estimated Value
Purchase Details
Closed on
Oct 12, 1999
Sold by
Christensen Dean C
Bought by
Johnson Jennie Kay
Home Financials for this Owner
Home Financials are based on the most recent Mortgage that was taken out on this home.
Original Mortgage
$114,000
Interest Rate
7.77%
Create a Home Valuation Report for This Property
The Home Valuation Report is an in-depth analysis detailing your home's value as well as a comparison with similar homes in the area
Home Values in the Area
Average Home Value in this Area
Purchase History
| Date | Buyer | Sale Price | Title Company |
|---|---|---|---|
| Wall Oran L | -- | Security Title & Abstract Co | |
| Johnson Jennie Kay | -- | Security Title & Abstract |
Source: Public Records
Mortgage History
| Date | Status | Borrower | Loan Amount |
|---|---|---|---|
| Previous Owner | Johnson Jennie Kay | $114,000 |
Source: Public Records
Tax History
| Year | Tax Paid | Tax Assessment Tax Assessment Total Assessment is a certain percentage of the fair market value that is determined by local assessors to be the total taxable value of land and additions on the property. | Land | Improvement |
|---|---|---|---|---|
| 2025 | $2,608 | $258,280 | -- | -- |
| 2024 | $2,608 | $256,740 | $0 | $0 |
| 2023 | $2,688 | $260,810 | $0 | $0 |
| 2022 | $2,783 | $272,305 | $0 | $0 |
| 2021 | $2,016 | $344,000 | $140,500 | $203,500 |
| 2020 | $1,955 | $312,700 | $127,700 | $185,000 |
| 2019 | $1,866 | $310,400 | $127,700 | $182,700 |
| 2018 | $1,656 | $279,500 | $120,600 | $158,900 |
| 2017 | $1,520 | $140,910 | $0 | $0 |
| 2016 | $1,345 | $116,270 | $0 | $0 |
| 2015 | $1,286 | $112,365 | $0 | $0 |
| 2014 | -- | $98,175 | $0 | $0 |
Source: Public Records
Map
Nearby Homes
Your Personal Tour Guide
Ask me questions while you tour the home.