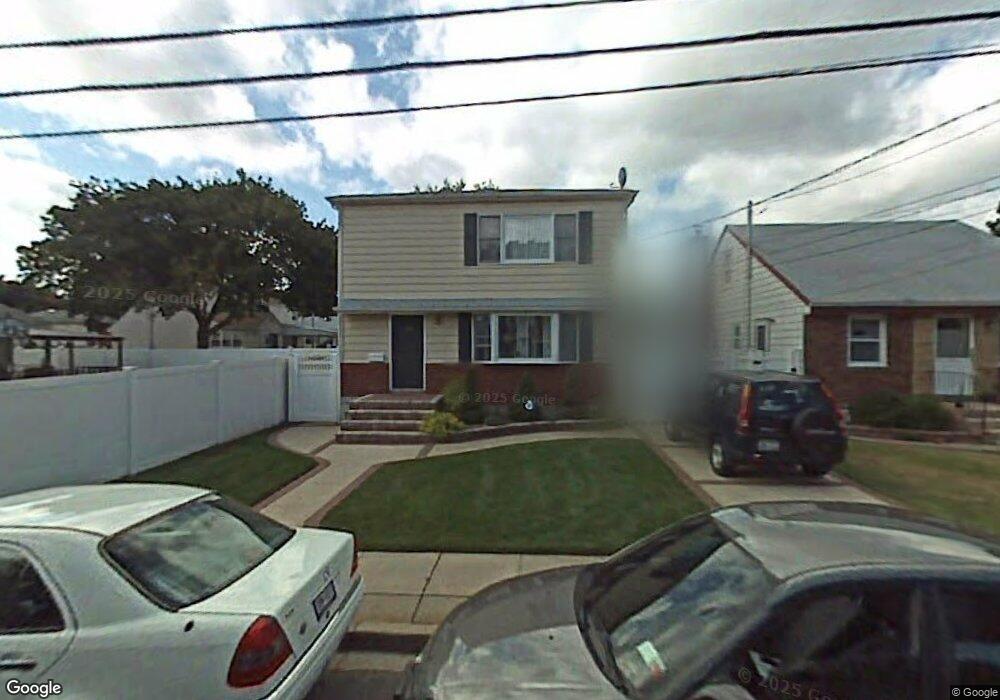
165 N 3rd St Bethpage, NY 11714
Estimated Value: $833,921 - $848,000
3
Beds
1
Bath
2,100
Sq Ft
$400/Sq Ft
Est. Value
About This Home
This home is located at 165 N 3rd St, Bethpage, NY 11714 and is currently estimated at $840,961, approximately $400 per square foot. 165 N 3rd St is a home located in Nassau County with nearby schools including Charles Campagne Elementary School, John F Kennedy Middle School, and Bethpage Senior High School.
Ownership History
Date
Name
Owned For
Owner Type
Purchase Details
Closed on
Sep 9, 2020
Sold by
Kola Stelios and Kola Despina
Bought by
Mavras Konstantinos and Mavras Maria
Current Estimated Value
Home Financials for this Owner
Home Financials are based on the most recent Mortgage that was taken out on this home.
Original Mortgage
$400,000
Outstanding Balance
$354,974
Interest Rate
2.9%
Mortgage Type
Seller Take Back
Estimated Equity
$485,987
Purchase Details
Closed on
May 14, 2003
Sold by
Blum William
Purchase Details
Closed on
Nov 3, 1998
Create a Home Valuation Report for This Property
The Home Valuation Report is an in-depth analysis detailing your home's value as well as a comparison with similar homes in the area
Home Values in the Area
Average Home Value in this Area
Purchase History
| Date | Buyer | Sale Price | Title Company |
|---|---|---|---|
| Mavras Konstantinos | $430,000 | First American Title | |
| -- | $330,000 | -- | |
| -- | -- | -- |
Source: Public Records
Mortgage History
| Date | Status | Borrower | Loan Amount |
|---|---|---|---|
| Open | Mavras Konstantinos | $400,000 |
Source: Public Records
Tax History
| Year | Tax Paid | Tax Assessment Tax Assessment Total Assessment is a certain percentage of the fair market value that is determined by local assessors to be the total taxable value of land and additions on the property. | Land | Improvement |
|---|---|---|---|---|
| 2025 | $16,386 | $587 | $202 | $385 |
| 2024 | $5,505 | $585 | $202 | $383 |
Source: Public Records
Map
Nearby Homes
Your Personal Tour Guide
Ask me questions while you tour the home.