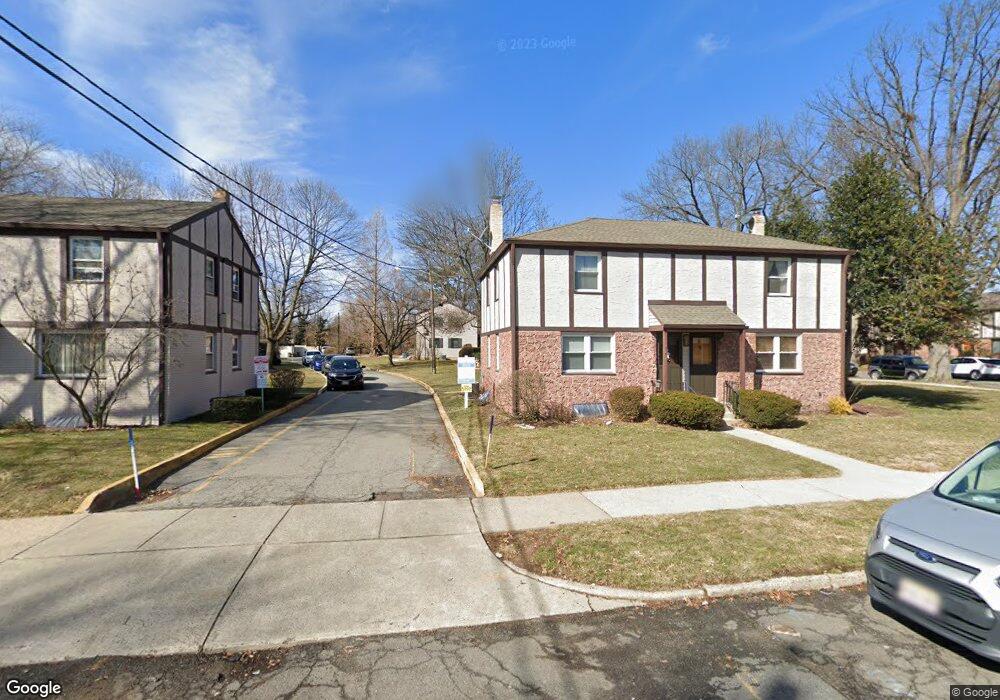
165 Newman St Metuchen, NJ 08840
Estimated Value: $388,735 - $414,000
--
Bed
--
Bath
--
Sq Ft
--
Built
About This Home
This home is located at 165 Newman St, Metuchen, NJ 08840 and is currently estimated at $403,684. 165 Newman St is a home located in Middlesex County with nearby schools including Edgar Middle School, Campbell Elementary School, and Metuchen High School.
Ownership History
Date
Name
Owned For
Owner Type
Purchase Details
Closed on
Jun 21, 2004
Sold by
Allgauer Andrew P
Bought by
Sun Rui Chang and Lu Jing
Current Estimated Value
Home Financials for this Owner
Home Financials are based on the most recent Mortgage that was taken out on this home.
Original Mortgage
$191,250
Outstanding Balance
$95,054
Interest Rate
6.25%
Estimated Equity
$308,630
Purchase Details
Closed on
Apr 8, 2002
Sold by
Maldonado Eduardo
Bought by
Allgauer Andrew and Allgauer Lucynda
Create a Home Valuation Report for This Property
The Home Valuation Report is an in-depth analysis detailing your home's value as well as a comparison with similar homes in the area
Home Values in the Area
Average Home Value in this Area
Purchase History
| Date | Buyer | Sale Price | Title Company |
|---|---|---|---|
| Sun Rui Chang | $225,000 | -- | |
| Allgauer Andrew | $156,000 | -- |
Source: Public Records
Mortgage History
| Date | Status | Borrower | Loan Amount |
|---|---|---|---|
| Open | Sun Rui Chang | $191,250 |
Source: Public Records
Tax History Compared to Growth
Tax History
| Year | Tax Paid | Tax Assessment Tax Assessment Total Assessment is a certain percentage of the fair market value that is determined by local assessors to be the total taxable value of land and additions on the property. | Land | Improvement |
|---|---|---|---|---|
| 2025 | $6,127 | $88,100 | $38,900 | $49,200 |
| 2024 | $5,922 | $88,100 | $38,900 | $49,200 |
| 2023 | $5,922 | $88,100 | $38,900 | $49,200 |
| 2022 | $5,613 | $88,100 | $38,900 | $49,200 |
| 2021 | $3,846 | $88,100 | $38,900 | $49,200 |
| 2020 | $5,412 | $88,100 | $38,900 | $49,200 |
| 2019 | $4,901 | $88,100 | $38,900 | $49,200 |
| 2018 | $5,239 | $88,100 | $38,900 | $49,200 |
| 2017 | $4,930 | $88,100 | $38,900 | $49,200 |
| 2016 | $5,083 | $88,100 | $38,900 | $49,200 |
| 2015 | $4,971 | $88,100 | $38,900 | $49,200 |
| 2014 | $4,846 | $88,100 | $38,900 | $49,200 |
Source: Public Records
Map
Nearby Homes