165 Peach Ln Moultrie, GA 31788
Estimated Value: $53,063 - $135,000
Studio
--
Bath
1,216
Sq Ft
$77/Sq Ft
Est. Value
About This Home
This home is located at 165 Peach Ln, Moultrie, GA 31788 and is currently estimated at $93,266, approximately $76 per square foot. 165 Peach Ln is a home with nearby schools including Sunset Elementary School, Willie J. Williams Middle School, and C.A. Gray Junior High School.
Ownership History
Date
Name
Owned For
Owner Type
Purchase Details
Closed on
Dec 12, 2007
Sold by
Campbell Steven C
Bought by
Herrera Jose Antonio Abelleyra and Farias Beatriz Madrid
Current Estimated Value
Home Financials for this Owner
Home Financials are based on the most recent Mortgage that was taken out on this home.
Original Mortgage
$32,000
Interest Rate
6.21%
Mortgage Type
New Conventional
Purchase Details
Closed on
Dec 22, 2003
Sold by
Brandon Investment Inc
Bought by
Campbell Steven
Purchase Details
Closed on
Nov 11, 2003
Sold by
Vanderbilt Mortgage And
Bought by
Brandon Investment Inc
Purchase Details
Closed on
Sep 23, 2003
Sold by
Johnson Evan
Bought by
Vanderbilt Mortgage And
Purchase Details
Closed on
Jun 28, 2002
Sold by
Conseco Bank Inc
Bought by
Johnson Evan
Purchase Details
Closed on
Apr 13, 2001
Sold by
Gregory Richard Craig
Bought by
Conseco Bank Inc
Purchase Details
Closed on
Feb 23, 2000
Sold by
Lambert James J
Bought by
Gregory Richard Craig
Create a Home Valuation Report for This Property
The Home Valuation Report is an in-depth analysis detailing your home's value as well as a comparison with similar homes in the area
Purchase History
| Date | Buyer | Sale Price | Title Company |
|---|---|---|---|
| Herrera Jose Antonio Abelleyra | $40,000 | -- | |
| Campbell Steven | $24,900 | -- | |
| Brandon Investment Inc | $9,000 | -- | |
| Vanderbilt Mortgage And | -- | -- | |
| Johnson Evan | $40,000 | -- | |
| Conseco Bank Inc | -- | -- | |
| Gregory Richard Craig | $14,000 | -- |
Source: Public Records
Mortgage History
| Date | Status | Borrower | Loan Amount |
|---|---|---|---|
| Closed | Herrera Jose Antonio Abelleyra | $32,000 |
Source: Public Records
Tax History
| Year | Tax Paid | Tax Assessment Tax Assessment Total Assessment is a certain percentage of the fair market value that is determined by local assessors to be the total taxable value of land and additions on the property. | Land | Improvement |
|---|---|---|---|---|
| 2025 | $254 | $12,066 | $9,547 | $2,519 |
| 2024 | $219 | $9,680 | $7,161 | $2,519 |
| 2023 | $230 | $9,680 | $7,161 | $2,519 |
| 2022 | $212 | $8,884 | $6,365 | $2,519 |
| 2021 | $201 | $8,284 | $6,365 | $1,919 |
| 2020 | $205 | $8,284 | $6,365 | $1,919 |
| 2019 | $228 | $8,284 | $6,365 | $1,919 |
| 2018 | $212 | $8,284 | $6,365 | $1,919 |
| 2017 | $299 | $10,998 | $9,079 | $1,919 |
| 2016 | -- | $10,799 | $9,079 | $1,720 |
| 2015 | -- | $10,799 | $9,079 | $1,720 |
| 2014 | -- | $10,799 | $9,079 | $1,720 |
| 2013 | -- | $0 | $0 | $0 |
Source: Public Records
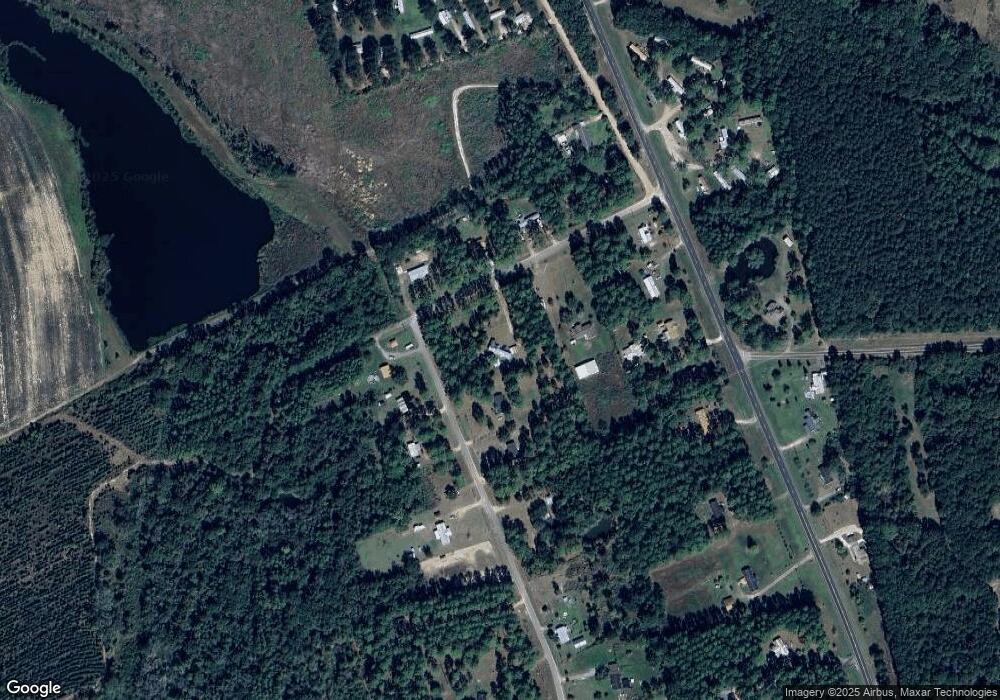
Map
Nearby Homes
- 00 Ragin Rd Unit 7
- 00 Ragin Rd Unit 12
- 0 US Highway 319 S
- XX Us Highway 319 S Unit 8-11
- 608 US Highway 319 S
- 96 Baell Trace Ct SE
- 110 Baell Trace Ct SE
- 534 Us Highway 319 S
- 207 Baell Trace Ct
- 206 Baell Trace Ct
- 370 Pearl St SE
- 117 Will Rd
- 205 Will Rd
- 135 Southlake Dr
- Lot22/23 Silverwood Ct
- 219 Cobblestone Blvd SE
- 387 Tanglewood Dr
- xx Ga Hwy 319 N
- 85 Cobblestone Blvd SE
- 264 Cobblestone Blvd SE
- 135 Blackberry Ln
- 0 Peach Ln Unit 10265273
- 0 Peach Ln
- 145 Peach Ln
- 110 Blackberry Ln
- 122 Blackberry Ln
- 1628 Ga Highway 33 S
- 1644 Ga Highway 33 S
- 1660 Ga Highway 33 S
- 185 Blackberry Ln
- 154 Blackberry Ln
- 1692 Ga Highway 33 S
- 1678 Ga Highway 33 S
- 270 Trailer Park Rd
- 256 Trailer Park Rd
- 138 Blackberry Ln
- 244 Trailer Park Rd
- 1724 Ga Highway 33 S
- 1100 Greenfield Church Rd
- 200 Blackberry Ln
Your Personal Tour Guide
Ask me questions while you tour the home.