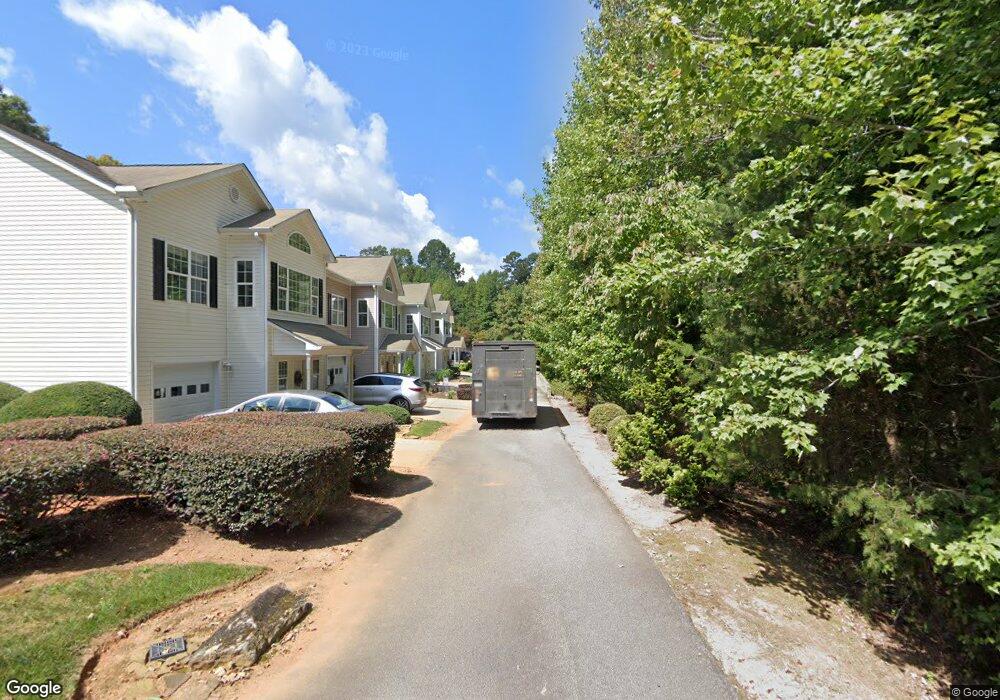
165 Pointe Cir Dahlonega, GA 30533
Estimated Value: $338,994 - $377,000
3
Beds
2
Baths
1,260
Sq Ft
$282/Sq Ft
Est. Value
About This Home
This home is located at 165 Pointe Cir, Dahlonega, GA 30533 and is currently estimated at $355,749, approximately $282 per square foot. 165 Pointe Cir is a home located in Lumpkin County with nearby schools including Lumpkin County High School.
Ownership History
Date
Name
Owned For
Owner Type
Purchase Details
Closed on
Mar 24, 2022
Sold by
Ortiz Ascencion Medrano
Bought by
Ortiz Ascencion Medrano and Medrano Sharon
Current Estimated Value
Home Financials for this Owner
Home Financials are based on the most recent Mortgage that was taken out on this home.
Original Mortgage
$213,573
Outstanding Balance
$197,745
Interest Rate
3.92%
Mortgage Type
FHA
Estimated Equity
$158,004
Purchase Details
Closed on
Jun 24, 2021
Sold by
Double C Investments Inc
Bought by
Warren Harley
Purchase Details
Closed on
Feb 23, 2021
Sold by
Wilson James Scott
Bought by
Double C Investments Inc
Purchase Details
Closed on
May 25, 2019
Sold by
Clarke Grant F
Bought by
Wilson James Scott
Purchase Details
Closed on
Aug 8, 2003
Sold by
Deerfield Partners
Bought by
Clarke Grant F and Clarke Jane
Create a Home Valuation Report for This Property
The Home Valuation Report is an in-depth analysis detailing your home's value as well as a comparison with similar homes in the area
Home Values in the Area
Average Home Value in this Area
Purchase History
| Date | Buyer | Sale Price | Title Company |
|---|---|---|---|
| Ortiz Ascencion Medrano | -- | -- | |
| Ortiz Ascencion Medrano | $259,900 | -- | |
| Warren Harley | -- | -- | |
| Double C Investments Inc | $50,000 | -- | |
| Wilson James Scott | $60,000 | -- | |
| Clarke Grant F | -- | -- |
Source: Public Records
Mortgage History
| Date | Status | Borrower | Loan Amount |
|---|---|---|---|
| Open | Ortiz Ascencion Medrano | $213,573 |
Source: Public Records
Tax History
| Year | Tax Paid | Tax Assessment Tax Assessment Total Assessment is a certain percentage of the fair market value that is determined by local assessors to be the total taxable value of land and additions on the property. | Land | Improvement |
|---|---|---|---|---|
| 2025 | $2,585 | $116,400 | $10,000 | $106,400 |
| 2024 | $2,585 | $108,549 | $10,000 | $98,549 |
| 2023 | $2,385 | $101,410 | $10,000 | $91,410 |
| 2022 | $875 | $41,003 | $10,000 | $31,003 |
| 2021 | $256 | $10,000 | $10,000 | $0 |
| 2020 | $264 | $10,000 | $10,000 | $0 |
| 2019 | $266 | $10,000 | $10,000 | $0 |
| 2018 | $428 | $15,099 | $10,536 | $4,563 |
| 2017 | $424 | $14,654 | $10,536 | $4,118 |
| 2016 | $426 | $14,236 | $10,536 | $3,700 |
| 2015 | $375 | $14,236 | $10,536 | $3,700 |
| 2014 | $375 | $14,236 | $10,536 | $3,700 |
| 2013 | -- | $14,699 | $10,536 | $4,163 |
Source: Public Records
Map
Nearby Homes
- 105 Pinewood Place
- 391 Pinewood Place
- 459 Gold Ridge Rd
- 250 Bridgestone Way
- 125 Lake Laurel Dr
- 6200 Bent Tree Cove
- 66 Martin Byers Rd
- 6439 S Chestatee
- 6035 Yellow Creek Rd
- 5937 Thompson Bridge Rd
- 433 Elliots Ln
- 90 English Ct
- 6038 S Chestatee
- 6124 Clyde Conner Rd
- 0 Fox Mountain Rd Unit 7699802
- 0 Fox Mountain Rd Unit 10666704
- 5781 Thompson Bridge Rd
- LOT 1 Mount Mincie Rd
- 6010 Ben Parks Rd
- 6022 Ben Parks Rd
- 165 E Point
- 12 Dohiyi Valley Rd
- 360 Grand Oak Ln
- 2184 Ben Higgins Rd
- 63 Kelley Ln
- 2182 Ben Higgins Rd
- 1415 River Flow Dr
- 1475 River Flow Dr
- 165 E Point Dr
- 174 Pinewood Place
- 135 Gold Ridge Rd
- 83 E Point Dr
- 153 Gold Ridge Rd
- 179 Pinewood Place
- E E Point Dr
- 81 E Point Dr
- 155 Gold Ridge Rd
- 95 Gold Ridge Rd
- 195 Pinewood Place
- 55 Pinewood Place
Your Personal Tour Guide
Ask me questions while you tour the home.