Estimated Value: $390,000 - $413,000
--
Bed
--
Bath
1,072
Sq Ft
$377/Sq Ft
Est. Value
About This Home
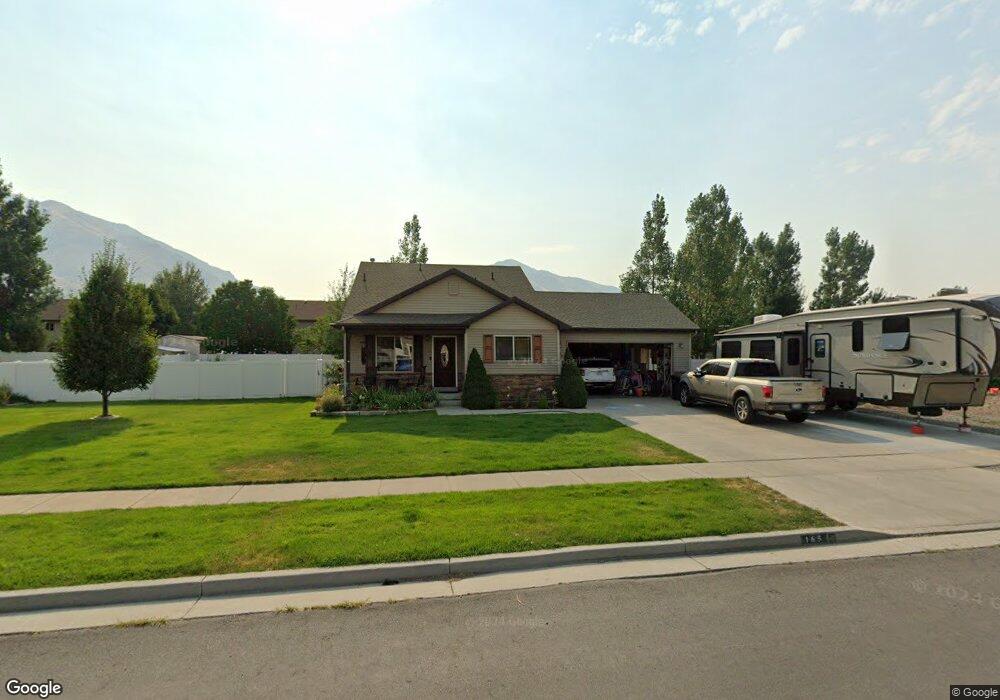
This home is located at 165 S 1130 E Unit 51, Hyrum, UT 84319 and is currently estimated at $403,652, approximately $376 per square foot. 165 S 1130 E Unit 51 is a home located in Cache County with nearby schools including Canyon School, South Cache Middle School, and Mountain Crest High School.
Ownership History
Date
Name
Owned For
Owner Type
Purchase Details
Closed on
May 21, 2013
Sold by
South Ridge Acres Llc
Bought by
Continental Development Inc
Current Estimated Value
Purchase Details
Closed on
May 13, 2010
Sold by
Kartchner Homes Cv Division Inc
Bought by
Frandsen Brian G and Frandsen Sheila
Home Financials for this Owner
Home Financials are based on the most recent Mortgage that was taken out on this home.
Original Mortgage
$173,469
Interest Rate
5.04%
Mortgage Type
New Conventional
Purchase Details
Closed on
Apr 20, 2010
Sold by
Continental Development Inc
Bought by
Kartchner Homes Cv Division Inc
Home Financials for this Owner
Home Financials are based on the most recent Mortgage that was taken out on this home.
Original Mortgage
$173,469
Interest Rate
5.04%
Mortgage Type
New Conventional
Create a Home Valuation Report for This Property
The Home Valuation Report is an in-depth analysis detailing your home's value as well as a comparison with similar homes in the area
Home Values in the Area
Average Home Value in this Area
Purchase History
| Date | Buyer | Sale Price | Title Company |
|---|---|---|---|
| Continental Development Inc | -- | Cache Title Logan | |
| Frandsen Brian G | -- | Cache Title Company Inc | |
| Kartchner Homes Cv Division Inc | -- | Cache Title Company |
Source: Public Records
Mortgage History
| Date | Status | Borrower | Loan Amount |
|---|---|---|---|
| Previous Owner | Frandsen Brian G | $173,469 | |
| Previous Owner | Kartchner Homes Cv Division Inc | $138,400 |
Source: Public Records
Tax History Compared to Growth
Tax History
| Year | Tax Paid | Tax Assessment Tax Assessment Total Assessment is a certain percentage of the fair market value that is determined by local assessors to be the total taxable value of land and additions on the property. | Land | Improvement |
|---|---|---|---|---|
| 2025 | $1,506 | $216,160 | $0 | $0 |
| 2024 | $1,603 | $214,920 | $0 | $0 |
| 2023 | $1,523 | $195,280 | $0 | $0 |
| 2022 | $1,590 | $195,280 | $0 | $0 |
| 2021 | $1,335 | $252,762 | $65,050 | $187,712 |
| 2020 | $1,285 | $228,278 | $65,050 | $163,228 |
| 2019 | $1,230 | $205,478 | $42,250 | $163,228 |
| 2018 | $1,164 | $187,990 | $42,250 | $145,740 |
| 2017 | $1,188 | $99,580 | $0 | $0 |
| 2016 | $1,215 | $88,080 | $0 | $0 |
| 2015 | $1,077 | $88,080 | $0 | $0 |
| 2014 | $1,054 | $88,080 | $0 | $0 |
| 2013 | -- | $88,080 | $0 | $0 |
Source: Public Records
Map
Nearby Homes