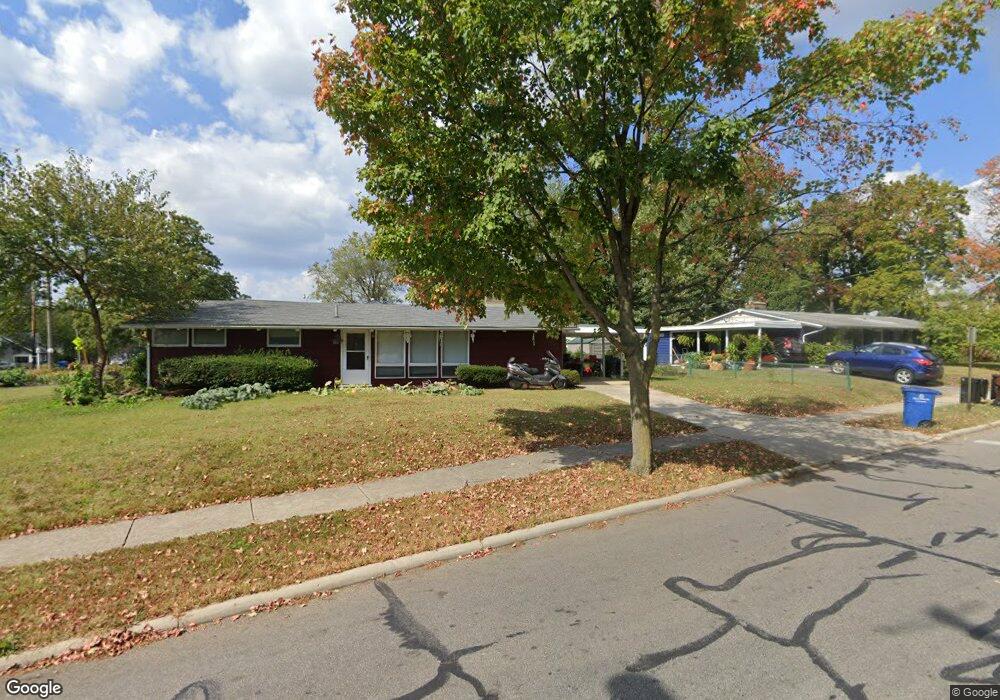
165 S Summit St Westerville, OH 43081
Estimated Value: $277,053 - $315,000
3
Beds
1
Bath
1,152
Sq Ft
$253/Sq Ft
Est. Value
About This Home
This home is located at 165 S Summit St, Westerville, OH 43081 and is currently estimated at $291,763, approximately $253 per square foot. 165 S Summit St is a home located in Franklin County with nearby schools including Whittier Elementary School, Blendon Middle School, and Westerville South High School.
Ownership History
Date
Name
Owned For
Owner Type
Purchase Details
Closed on
Jul 29, 2009
Sold by
Dandrea Edward J and Edward J Dandrea Trust Agreeme
Bought by
Stanley Creighton B
Current Estimated Value
Home Financials for this Owner
Home Financials are based on the most recent Mortgage that was taken out on this home.
Original Mortgage
$90,000
Outstanding Balance
$58,165
Interest Rate
5.36%
Mortgage Type
Purchase Money Mortgage
Estimated Equity
$233,598
Purchase Details
Closed on
Mar 3, 2006
Sold by
Dandrea Edward J and Dandrea Rose M
Bought by
Dandrea Edward J and Edward J Dandrea Trust
Purchase Details
Closed on
Aug 22, 2003
Sold by
Limbach Esther
Bought by
Dandrea Edward J and Dandrea Rose M
Home Financials for this Owner
Home Financials are based on the most recent Mortgage that was taken out on this home.
Original Mortgage
$78,750
Interest Rate
5.31%
Mortgage Type
Purchase Money Mortgage
Purchase Details
Closed on
Dec 10, 1964
Bought by
Limbach Esther A
Create a Home Valuation Report for This Property
The Home Valuation Report is an in-depth analysis detailing your home's value as well as a comparison with similar homes in the area
Home Values in the Area
Average Home Value in this Area
Purchase History
| Date | Buyer | Sale Price | Title Company |
|---|---|---|---|
| Stanley Creighton B | $112,500 | Title First | |
| Dandrea Edward J | -- | None Available | |
| Dandrea Rose | -- | None Available | |
| Dandrea Edward J | $105,000 | -- | |
| Limbach Esther A | -- | -- |
Source: Public Records
Mortgage History
| Date | Status | Borrower | Loan Amount |
|---|---|---|---|
| Open | Stanley Creighton B | $90,000 | |
| Previous Owner | Dandrea Edward J | $78,750 |
Source: Public Records
Tax History
| Year | Tax Paid | Tax Assessment Tax Assessment Total Assessment is a certain percentage of the fair market value that is determined by local assessors to be the total taxable value of land and additions on the property. | Land | Improvement |
|---|---|---|---|---|
| 2025 | $4,062 | $71,470 | $23,660 | $47,810 |
| 2024 | $4,062 | $71,470 | $23,660 | $47,810 |
| 2023 | $3,976 | $71,470 | $23,660 | $47,810 |
| 2022 | $3,631 | $49,840 | $16,800 | $33,040 |
| 2021 | $3,662 | $49,840 | $16,800 | $33,040 |
| 2020 | $3,651 | $49,840 | $16,800 | $33,040 |
| 2019 | $3,235 | $41,690 | $16,800 | $24,890 |
| 2018 | $3,060 | $41,690 | $16,800 | $24,890 |
| 2017 | $3,113 | $41,690 | $16,800 | $24,890 |
| 2016 | $3,043 | $36,300 | $12,010 | $24,290 |
| 2015 | $2,948 | $36,300 | $12,010 | $24,290 |
| 2014 | $2,950 | $36,300 | $12,010 | $24,290 |
| 2013 | $1,473 | $36,295 | $12,005 | $24,290 |
Source: Public Records
Map
Nearby Homes
- 35 Hiawatha Ave
- 133 Illinois Ave
- 328 Myrtle Dr Unit Lot 5
- 348 Myrtle Dr Unit Lot 10
- 337 Myrtle Dr Unit Lot 2
- 334 Myrtle Dr Unit Lot 7
- 342 Myrtle Dr Unit Lot 8
- 344 Myrtle Dr Unit Lot 9
- 92 N Vine St
- 480 S State St
- 415-417 E Walnut St
- 291 Mohawk Ave
- 525 Foxtrail Cir E Unit 24
- 410 Six Pence Cir
- 339 Aylesbury Dr S
- 355 Nature Trail Unit 355
- 487 Beachside Dr
- 488 Belle Haven Ct
- 261 Dogwood Ln
- 204 Barcelona Ave
- 96 E Walnut St
- 155 S Summit St
- 90 E Walnut St
- 118 E Walnut St
- 164 S Summit St
- 149 S Summit St
- 158 S Summit St
- 128 E Walnut St
- 150 S Summit St
- 141 S Summit St Unit 143
- 137 S Summit St
- 137 S Summit St Unit 139
- 142 S Summit St
- 65 Walnut St
- 63 E Walnut St
- 63 E Walnut St
- 57 E Walnut St
- 126 S Summit St
- 53 E Walnut St
- 47 E Walnut St
Your Personal Tour Guide
Ask me questions while you tour the home.