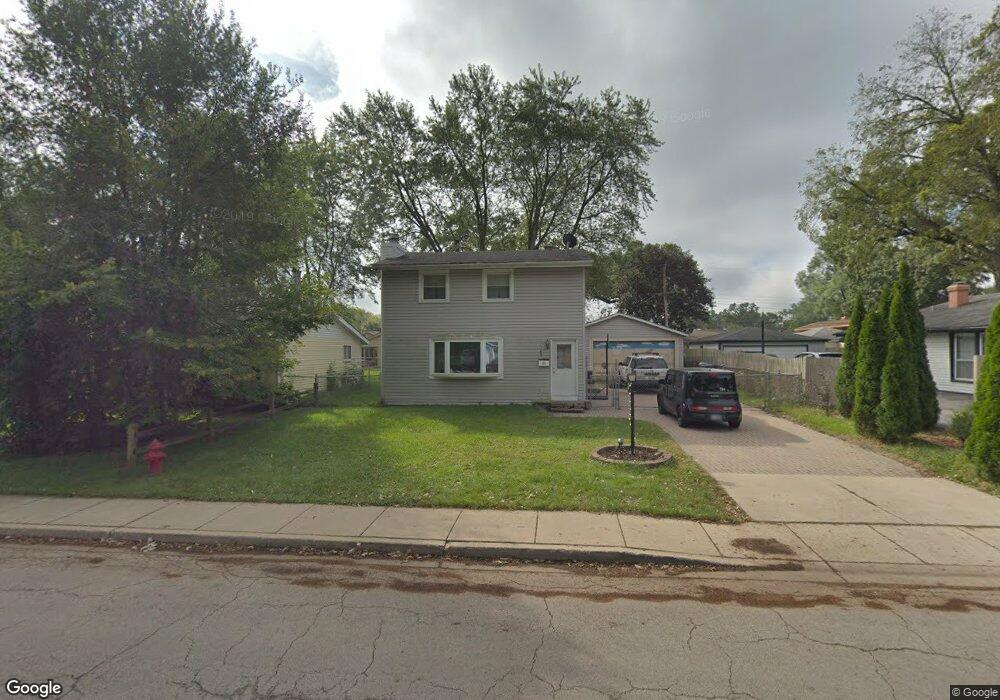
165 Sioux Ave Carpentersville, IL 60110
Estimated Value: $263,759 - $299,000
3
Beds
--
Bath
1,400
Sq Ft
$199/Sq Ft
Est. Value
About This Home
This home is located at 165 Sioux Ave, Carpentersville, IL 60110 and is currently estimated at $278,690, approximately $199 per square foot. 165 Sioux Ave is a home located in Kane County with nearby schools including Sunny Hill Elementary School, Barrington Mdle School- Prairie Cmps, and Barrington High School.
Ownership History
Date
Name
Owned For
Owner Type
Purchase Details
Closed on
May 12, 2004
Sold by
Carrillo Alicia and Carrillo Veronica
Bought by
Carrillo Alicia
Current Estimated Value
Home Financials for this Owner
Home Financials are based on the most recent Mortgage that was taken out on this home.
Original Mortgage
$140,000
Interest Rate
6.75%
Mortgage Type
New Conventional
Purchase Details
Closed on
Jun 3, 2003
Sold by
Martinez Fernando and Castro Marcos
Bought by
Carrillo Alicia and Carrillo Veronica
Purchase Details
Closed on
May 9, 2003
Sold by
Cruz Juan
Bought by
Martinez Garcia Fernando and Castro Marcos
Purchase Details
Closed on
Jun 28, 2001
Sold by
Ansel John W and Ansel Joann
Bought by
Cruz Juan and Martinez Garcia Fernando
Home Financials for this Owner
Home Financials are based on the most recent Mortgage that was taken out on this home.
Original Mortgage
$132,900
Interest Rate
7.2%
Mortgage Type
FHA
Create a Home Valuation Report for This Property
The Home Valuation Report is an in-depth analysis detailing your home's value as well as a comparison with similar homes in the area
Home Values in the Area
Average Home Value in this Area
Purchase History
| Date | Buyer | Sale Price | Title Company |
|---|---|---|---|
| Carrillo Alicia | -- | Law Title | |
| Carrillo Alicia | $146,000 | -- | |
| Martinez Garcia Fernando | -- | -- | |
| Cruz Juan | $135,000 | Chicago Title Insurance Co |
Source: Public Records
Mortgage History
| Date | Status | Borrower | Loan Amount |
|---|---|---|---|
| Previous Owner | Carrillo Alicia | $140,000 | |
| Previous Owner | Cruz Juan | $132,900 | |
| Closed | Carrillo Alicia | $35,000 |
Source: Public Records
Tax History Compared to Growth
Tax History
| Year | Tax Paid | Tax Assessment Tax Assessment Total Assessment is a certain percentage of the fair market value that is determined by local assessors to be the total taxable value of land and additions on the property. | Land | Improvement |
|---|---|---|---|---|
| 2024 | $5,409 | $77,998 | $12,553 | $65,445 |
| 2023 | $5,139 | $70,180 | $11,295 | $58,885 |
| 2022 | $4,629 | $59,893 | $11,295 | $48,598 |
| 2021 | $4,440 | $56,551 | $10,665 | $45,886 |
| 2020 | $4,229 | $55,279 | $10,425 | $44,854 |
| 2019 | $3,984 | $52,477 | $9,897 | $42,580 |
| 2018 | $3,610 | $46,339 | $9,701 | $36,638 |
| 2017 | $3,341 | $43,348 | $9,075 | $34,273 |
| 2016 | $3,138 | $39,370 | $8,787 | $30,583 |
| 2015 | -- | $33,747 | $8,234 | $25,513 |
| 2014 | -- | $30,157 | $8,007 | $22,150 |
| 2013 | -- | $31,080 | $8,252 | $22,828 |
Source: Public Records
Map
Nearby Homes
- 336 Delaware St
- 155 Helm Rd
- 944 Cortney Dr
- 153 Algonquin Rd
- 103 Hickory Dr
- 7 Autumn Trail
- 140 Hickory Dr
- 1811 IL Rte 25 (Elgin) Rd
- 94 Wren Rd
- 1426 Kings Rd
- 57 Robin Rd
- 105 Siesta Rd
- 2013 Silverstone Dr Unit 2013
- 2245 Flagstone Ln Unit 155
- 200 Amarillo Dr
- 1431 Silverstone Dr Unit 1416
- 7 Hickory Dr
- 308 Amarillo Ct
- 225 Westfield Way
- 7 Austin Ave