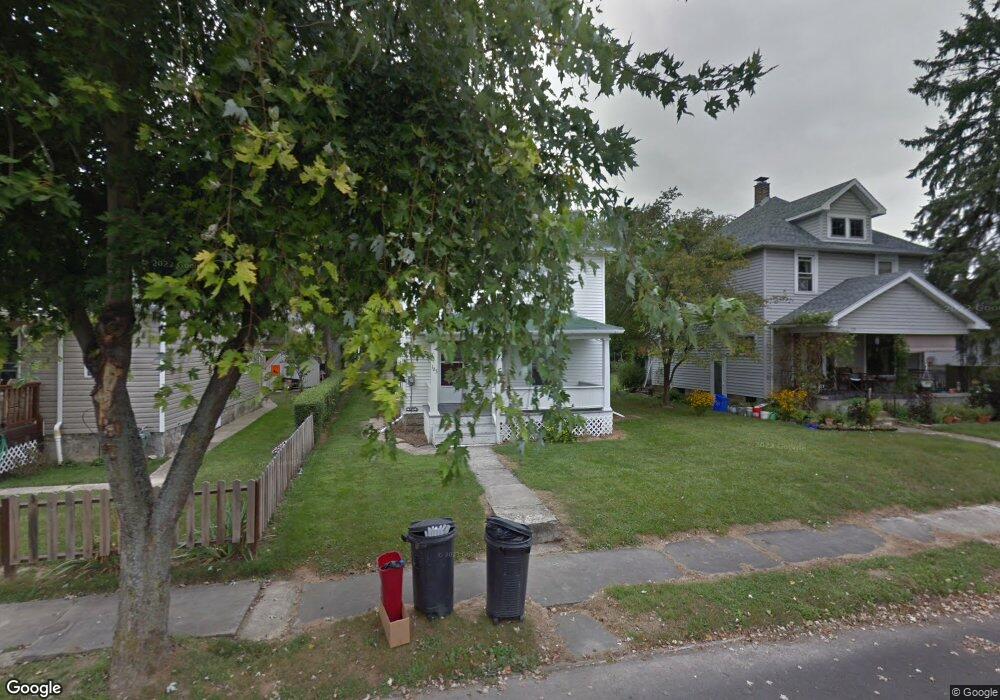
165 Spencer (P) Marion, OH 43302
Estimated Value: $126,000 - $167,000
3
Beds
1
Bath
1,144
Sq Ft
$127/Sq Ft
Est. Value
About This Home
This home is located at 165 Spencer (P), Marion, OH 43302 and is currently estimated at $144,759, approximately $126 per square foot. 165 Spencer (P) is a home located in Marion County with nearby schools including George Washington Elementary School, Ulysses S. Grant Middle School, and Harding High School.
Ownership History
Date
Name
Owned For
Owner Type
Purchase Details
Closed on
Jan 4, 2024
Sold by
Wright Aaron and Wright Beverlee Sue
Bought by
Wright Aaron and Wright Beverlee Sue
Current Estimated Value
Purchase Details
Closed on
Nov 25, 2009
Sold by
Fannie Mae
Bought by
Wright Aaron and Wright Beverlee Sue
Home Financials for this Owner
Home Financials are based on the most recent Mortgage that was taken out on this home.
Original Mortgage
$35,362
Interest Rate
4.96%
Mortgage Type
Future Advance Clause Open End Mortgage
Purchase Details
Closed on
Aug 25, 2009
Sold by
Walsh Katherine M
Bought by
Us Bank Na
Purchase Details
Closed on
Jul 13, 2007
Sold by
Donaugh Milbourne E and Donaugh Phyllis R
Bought by
Walsh Katherine M
Home Financials for this Owner
Home Financials are based on the most recent Mortgage that was taken out on this home.
Original Mortgage
$65,000
Interest Rate
6.42%
Mortgage Type
New Conventional
Create a Home Valuation Report for This Property
The Home Valuation Report is an in-depth analysis detailing your home's value as well as a comparison with similar homes in the area
Home Values in the Area
Average Home Value in this Area
Purchase History
| Date | Buyer | Sale Price | Title Company |
|---|---|---|---|
| Wright Aaron | $11,250 | None Listed On Document | |
| Wright Aaron | $11,250 | None Listed On Document | |
| Wright Aaron | $31,500 | Chicago Title | |
| Us Bank Na | $40,000 | None Available | |
| Walsh Katherine M | $65,000 | Chicago Title |
Source: Public Records
Mortgage History
| Date | Status | Borrower | Loan Amount |
|---|---|---|---|
| Previous Owner | Wright Aaron | $35,362 | |
| Previous Owner | Walsh Katherine M | $65,000 |
Source: Public Records
Tax History Compared to Growth
Tax History
| Year | Tax Paid | Tax Assessment Tax Assessment Total Assessment is a certain percentage of the fair market value that is determined by local assessors to be the total taxable value of land and additions on the property. | Land | Improvement |
|---|---|---|---|---|
| 2024 | $1,031 | $26,900 | $4,670 | $22,230 |
| 2023 | $1,031 | $26,900 | $4,670 | $22,230 |
| 2022 | $957 | $26,900 | $4,670 | $22,230 |
| 2021 | $825 | $20,900 | $4,060 | $16,840 |
| 2020 | $827 | $20,900 | $4,060 | $16,840 |
| 2019 | $827 | $20,900 | $4,060 | $16,840 |
| 2018 | $875 | $22,130 | $4,060 | $18,070 |
| 2017 | $887 | $22,130 | $4,060 | $18,070 |
| 2016 | $884 | $22,130 | $4,060 | $18,070 |
| 2015 | $881 | $21,590 | $3,870 | $17,720 |
| 2014 | $881 | $21,590 | $3,870 | $17,720 |
| 2012 | $1,067 | $25,940 | $4,540 | $21,400 |
Source: Public Records
Map
Nearby Homes
- 144 Spencer St
- 1185 E Center St
- 145 Sara Ave
- 164 Clover Ave
- 1090 E Church St
- 1225 Ackerman Ave
- 1195 Indiana Ave
- 310 Denning Ave
- 174 Barnhart St
- 357 Franconia Ave
- 0 Denning Ave
- 399 Kilbury Rd
- 851 E Center St
- 400 Forest Lawn Blvd
- 222 Uhler Ave
- 381 Forest Lawn Blvd
- 126 S Seffner Ave
- 488 Forest Lawn Blvd
- 499 Carolyn Dr
- 921 Adams St
- 159 Spencer St
- 160 Spencer St
- 165 Spencer St
- 166 Spencer St
- 153 Spencer St
- 154 Spencer St
- 171 Spencer St
- 168 Spencer St
- 150 Spencer St
- 149 Spencer St
- 1200 E Church St
- 1212 E Church St
- 143 Spencer St
- 1216 E Church St
- 1188 E Church St
- 136 Spencer St
- 137 Spencer St
- 1224 E Church St
- 156 Homer St
- 162 Homer St