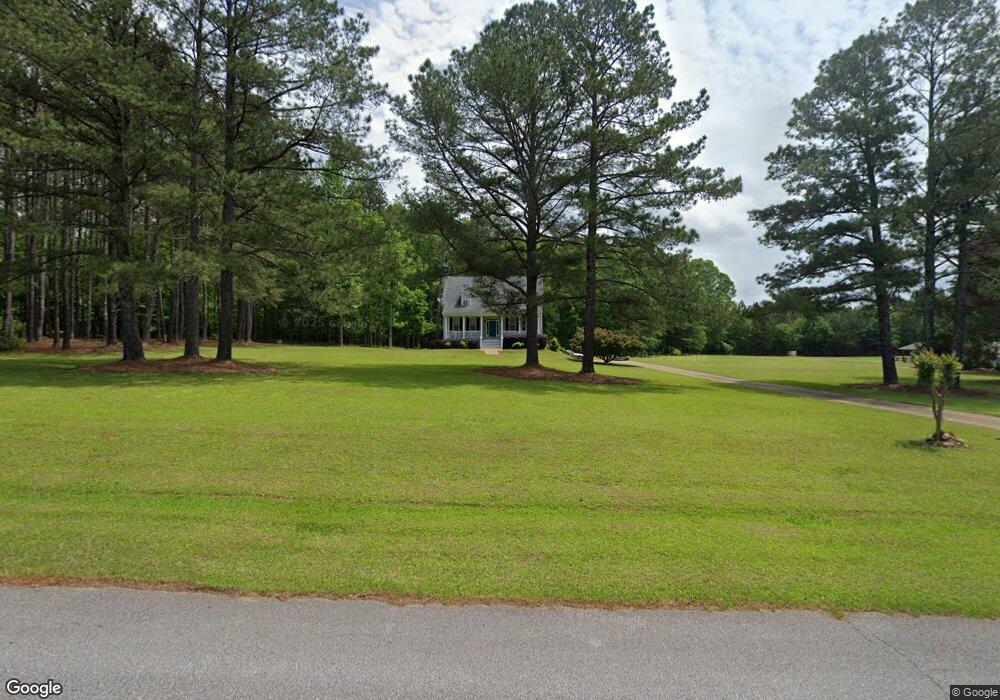
165 Summerville Dr Brooks, GA 30205
Whitewater NeighborhoodEstimated Value: $499,331 - $587,000
--
Bed
1
Bath
2,278
Sq Ft
$238/Sq Ft
Est. Value
About This Home
This home is located at 165 Summerville Dr, Brooks, GA 30205 and is currently estimated at $541,333, approximately $237 per square foot. 165 Summerville Dr is a home located in Fayette County with nearby schools including Sara Harp Minter Elementary School, Whitewater Middle School, and Whitewater High School.
Ownership History
Date
Name
Owned For
Owner Type
Purchase Details
Closed on
Jul 27, 2009
Sold by
Byrum John S and Byrum Georgina L
Bought by
Byrum John S and Byrum Georgina L
Current Estimated Value
Home Financials for this Owner
Home Financials are based on the most recent Mortgage that was taken out on this home.
Original Mortgage
$148,400
Outstanding Balance
$97,544
Interest Rate
5.37%
Mortgage Type
New Conventional
Estimated Equity
$443,789
Purchase Details
Closed on
Nov 4, 2008
Sold by
Chase Hm Fin Llc
Bought by
Martin Ted G
Purchase Details
Closed on
Jun 7, 2005
Sold by
Landstedt J T
Bought by
Martin Ted G
Home Financials for this Owner
Home Financials are based on the most recent Mortgage that was taken out on this home.
Original Mortgage
$217,450
Interest Rate
5.69%
Mortgage Type
New Conventional
Create a Home Valuation Report for This Property
The Home Valuation Report is an in-depth analysis detailing your home's value as well as a comparison with similar homes in the area
Home Values in the Area
Average Home Value in this Area
Purchase History
| Date | Buyer | Sale Price | Title Company |
|---|---|---|---|
| Byrum John S | -- | -- | |
| Byrum John S | -- | -- | |
| Martin Ted G | $216,973 | -- | |
| Martin Ted G | $271,900 | -- |
Source: Public Records
Mortgage History
| Date | Status | Borrower | Loan Amount |
|---|---|---|---|
| Open | Byrum John S | $148,400 | |
| Closed | Byrum John S | $18,550 | |
| Previous Owner | Martin Ted G | $217,450 | |
| Previous Owner | Martin Ted G | $40,800 |
Source: Public Records
Tax History Compared to Growth
Tax History
| Year | Tax Paid | Tax Assessment Tax Assessment Total Assessment is a certain percentage of the fair market value that is determined by local assessors to be the total taxable value of land and additions on the property. | Land | Improvement |
|---|---|---|---|---|
| 2024 | $3,490 | $171,788 | $34,000 | $137,788 |
| 2023 | $3,090 | $165,040 | $34,000 | $131,040 |
| 2022 | $3,386 | $158,320 | $34,000 | $124,320 |
| 2021 | $3,067 | $123,400 | $20,000 | $103,400 |
| 2020 | $3,226 | $116,600 | $20,000 | $96,600 |
| 2019 | $3,108 | $111,240 | $20,000 | $91,240 |
| 2018 | $2,947 | $104,440 | $20,000 | $84,440 |
| 2017 | $2,844 | $100,520 | $20,000 | $80,520 |
| 2016 | $2,623 | $90,952 | $20,232 | $70,720 |
| 2015 | $2,480 | $84,632 | $20,232 | $64,400 |
| 2014 | $2,290 | $76,952 | $20,232 | $56,720 |
| 2013 | -- | $72,592 | $0 | $0 |
Source: Public Records
Map
Nearby Homes
- 259 Massengale Rd
- 180 Burkwood Ct
- 110 Lullwood Ct
- 261 Highway 85 Connector
- 2135 Highway 85 S
- 153 Highway 85 Connector
- 140 Manor Dr
- 370 Darren Dr
- 360 Darren Dr
- 246 Matthews Rd Unit TRACT A 5 ACRES
- 100 Southmill Ln
- 270 Carrolls Way
- 135 Woodbridge Place
- 40 Riverstone Dr
- 180 Brechin Dr
- 555 Mountains Edge
- LOT 13 Carrolls Way
- 140 Bontura Dr
- 125 Pinewood Dr
- 140 Alford Dr
- 155 Summerville Dr
- 175 Summerville Dr
- 170 Summerville Dr
- 160 Summerville Dr
- 145 Summerville Dr
- 185 Summerville Dr
- 180 Summerville Dr
- 150 Summerville Dr
- 140 Summerville Dr
- 125 Summerville Dr
- 179 Massengale Rd
- 130 Summerville Dr
- 155 Blanche Dr
- 231 Massengale Rd
- 159 Massengale Rd
- 120 Summerville Dr
- 145 Blanche Dr
- 135 Blanche Dr
- 105 Summerville Dr
- 220 Massengale Rd