Estimated Value: $451,613 - $531,000
3
Beds
1
Bath
1,674
Sq Ft
$289/Sq Ft
Est. Value
About This Home
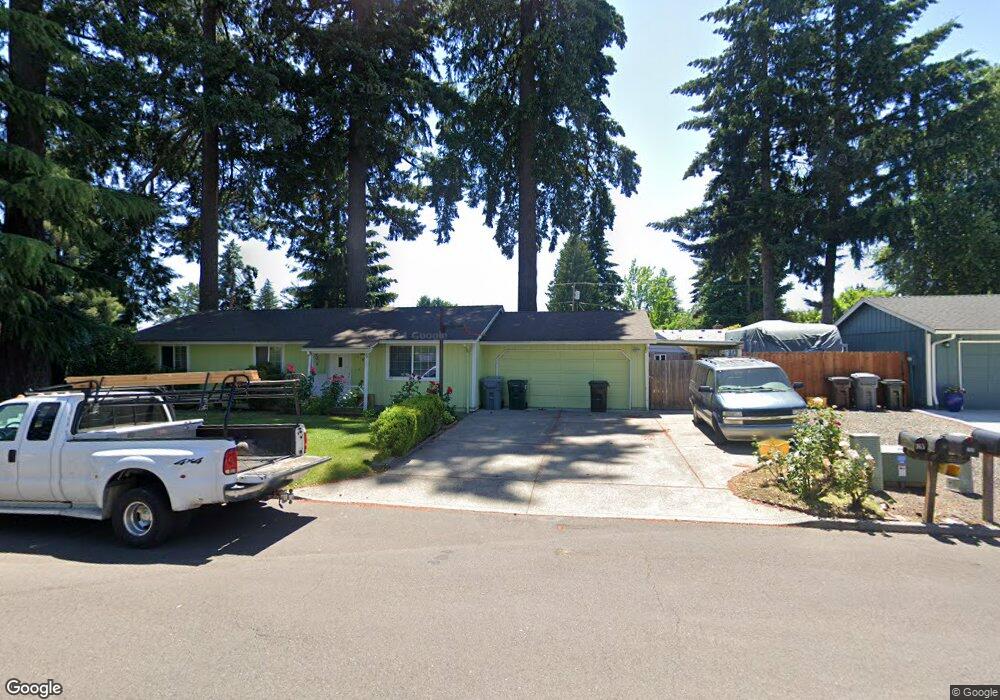
This home is located at 165 SW 6th Place, Canby, OR 97013 and is currently estimated at $483,903, approximately $289 per square foot. 165 SW 6th Place is a home located in Clackamas County with nearby schools including Josefa L. Sambrano Elementary School, Philander Lee Elementary School, and Baker Prairie Middle School.
Ownership History
Date
Name
Owned For
Owner Type
Purchase Details
Closed on
May 24, 2021
Sold by
Duran Ancelmo
Bought by
Duran Ancelmo and Barajas Rosalinda
Current Estimated Value
Home Financials for this Owner
Home Financials are based on the most recent Mortgage that was taken out on this home.
Original Mortgage
$234,900
Outstanding Balance
$212,086
Interest Rate
3%
Mortgage Type
New Conventional
Estimated Equity
$271,817
Purchase Details
Closed on
Dec 21, 2002
Sold by
Duran Heliberto and Duran Eduardo
Bought by
Duran Ancelmo
Home Financials for this Owner
Home Financials are based on the most recent Mortgage that was taken out on this home.
Original Mortgage
$147,800
Interest Rate
5.89%
Mortgage Type
Purchase Money Mortgage
Purchase Details
Closed on
Jun 30, 1998
Sold by
Zauner Barry P and Zauner Janiece M
Bought by
Usinger Aaron B and Usinger Lory J
Home Financials for this Owner
Home Financials are based on the most recent Mortgage that was taken out on this home.
Original Mortgage
$113,600
Interest Rate
10.25%
Create a Home Valuation Report for This Property
The Home Valuation Report is an in-depth analysis detailing your home's value as well as a comparison with similar homes in the area
Home Values in the Area
Average Home Value in this Area
Purchase History
| Date | Buyer | Sale Price | Title Company |
|---|---|---|---|
| Duran Ancelmo | -- | First American | |
| Duran Ancelmo | -- | Pacific Nw Title | |
| Usinger Aaron B | $142,000 | Chicago Title Insurance Co |
Source: Public Records
Mortgage History
| Date | Status | Borrower | Loan Amount |
|---|---|---|---|
| Open | Duran Ancelmo | $234,900 | |
| Closed | Duran Ancelmo | $147,800 | |
| Closed | Usinger Aaron B | $113,600 | |
| Closed | Usinger Aaron B | $14,200 |
Source: Public Records
Tax History Compared to Growth
Tax History
| Year | Tax Paid | Tax Assessment Tax Assessment Total Assessment is a certain percentage of the fair market value that is determined by local assessors to be the total taxable value of land and additions on the property. | Land | Improvement |
|---|---|---|---|---|
| 2025 | $3,795 | $214,212 | -- | -- |
| 2024 | $3,689 | $207,973 | -- | -- |
| 2023 | $3,689 | $201,916 | $0 | $0 |
| 2022 | $3,393 | $196,035 | $0 | $0 |
| 2021 | $3,267 | $190,326 | $0 | $0 |
| 2020 | $3,209 | $184,783 | $0 | $0 |
| 2019 | $3,056 | $179,401 | $0 | $0 |
| 2018 | $2,987 | $174,176 | $0 | $0 |
| 2017 | $2,912 | $169,103 | $0 | $0 |
| 2016 | $2,815 | $164,178 | $0 | $0 |
| 2015 | $2,718 | $159,396 | $0 | $0 |
| 2014 | $2,640 | $154,753 | $0 | $0 |
Source: Public Records
Map
Nearby Homes
- 574 S Ivy St
- 481 S Holly St
- 248 SE Township Rd
- 299 SW 3rd Ave
- 363 SE 7th Ave
- 385 SE Township Rd
- 486 S Knott St
- 331 SE 9th Ave
- 387 SE 7th Ave
- 431 SW 3rd Ave
- 423 SE 7th Ave
- 1491 S Fir St Unit 18
- 1487 S Fir St Unit Lot17
- 1485 S Fir St Unit Lot 16
- 201 SE 16th Ave
- 550 SE 5th Ave
- 582 S Maple St
- 620 SE 2nd Ave
- 620 SE 2nd Ave Unit 11
- 1400 S Elm St Unit 91
- 200 SW 7th Ave
- 131 SW 6th Place
- 209 SW 6th Place
- 220 SW 7th Ave
- 170 SW 6th Place
- 150 SW 6th Place
- 190 SW 7th Ave
- 214 SW 6th Place
- 127 SW 6th Place
- 221 SW 6th Place
- 230 SW 7th Ave
- 215 SW 7th Ave
- 130 SW 6th Place
- 225 SW 7th Ave
- 250 SW 6th Place
- 195 SW 6th Ave
- 195 SW 7th Ave
- 207 SW 6th Ave
- 185 SW 6th Ave
- 235 SW 7th Ave