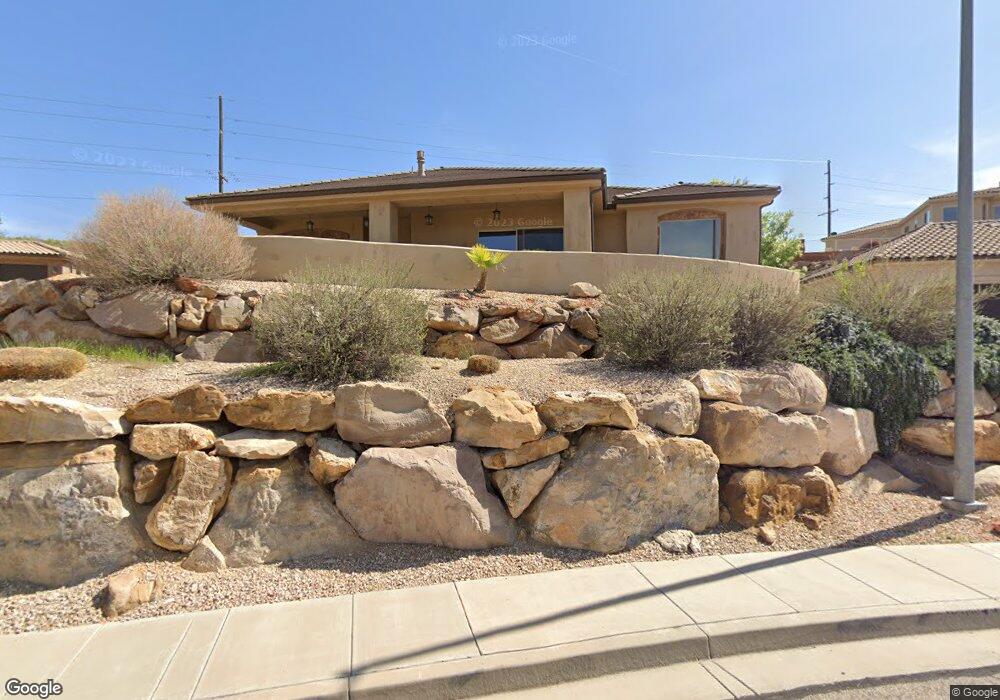
165 W Dolce Cove Saint George, UT 84770
Estimated Value: $687,150 - $739,000
3
Beds
3
Baths
2,500
Sq Ft
$285/Sq Ft
Est. Value
About This Home
This home is located at 165 W Dolce Cove, Saint George, UT 84770 and is currently estimated at $712,788, approximately $285 per square foot. 165 W Dolce Cove is a home with nearby schools including Bloomington Elementary School, Dixie Intermediate School, and Dixie Middle School.
Ownership History
Date
Name
Owned For
Owner Type
Purchase Details
Closed on
Jun 4, 2025
Sold by
Wilburt G Taylor Family Trust and Taylor Wilburt G
Bought by
Taylor Revocable Trust and Taylor
Current Estimated Value
Purchase Details
Closed on
Dec 19, 2018
Sold by
Taylor Wilburt G
Bought by
Taylor Wilburt G and Wilburt G Taylor Family Trust
Purchase Details
Closed on
Sep 18, 2014
Sold by
Sweaney Jeff
Bought by
Taylor Wilburt G and Taylor Nancy L
Purchase Details
Closed on
Jun 27, 2012
Sold by
Crooked River Development Llc
Bought by
Sweaney Jeff
Purchase Details
Closed on
Mar 13, 2012
Sold by
Mill Gate Holdings Llc
Bought by
Crooked River Development Llc
Purchase Details
Closed on
Jun 29, 2011
Sold by
Anb Venture Llc
Bought by
Mill Gate Holdings Llc
Purchase Details
Closed on
Mar 30, 2011
Sold by
Remington Group Construction Inc
Bought by
Anb Venture Llc
Purchase Details
Closed on
Dec 8, 2005
Sold by
Bella Viaggio Subdivision Lc
Bought by
Remington Group Construction Inc
Create a Home Valuation Report for This Property
The Home Valuation Report is an in-depth analysis detailing your home's value as well as a comparison with similar homes in the area
Home Values in the Area
Average Home Value in this Area
Purchase History
| Date | Buyer | Sale Price | Title Company |
|---|---|---|---|
| Taylor Revocable Trust | -- | None Listed On Document | |
| Taylor Wilburt G | -- | None Available | |
| Taylor Wilburt G | -- | Skyview Title Ins Agency | |
| Sweaney Jeff | -- | Southern Utah Title | |
| Crooked River Development Llc | -- | None Available | |
| Mill Gate Holdings Llc | -- | Southern Utah Title | |
| Anb Venture Llc | $500,000 | None Available | |
| Remington Group Construction Inc | -- | Accommodation |
Source: Public Records
Tax History Compared to Growth
Tax History
| Year | Tax Paid | Tax Assessment Tax Assessment Total Assessment is a certain percentage of the fair market value that is determined by local assessors to be the total taxable value of land and additions on the property. | Land | Improvement |
|---|---|---|---|---|
| 2025 | $2,229 | $339,130 | $99,825 | $239,305 |
| 2023 | $2,342 | $349,965 | $99,825 | $250,140 |
| 2022 | $2,370 | $333,025 | $81,675 | $251,350 |
| 2021 | $2,193 | $459,500 | $132,000 | $327,500 |
| 2020 | $2,184 | $431,100 | $99,000 | $332,100 |
| 2019 | $2,045 | $394,200 | $93,500 | $300,700 |
| 2018 | $2,091 | $208,175 | $0 | $0 |
| 2017 | $1,989 | $192,225 | $0 | $0 |
| 2016 | $2,042 | $182,490 | $0 | $0 |
| 2015 | $3,735 | $320,300 | $0 | $0 |
| 2014 | $1,763 | $152,130 | $0 | $0 |
Source: Public Records
Map
Nearby Homes
- 181 W Mojave Heights Dr
- 388 W Sir Monte Dr
- 199 W 2025 S Unit 63
- 199 W 2025 S Unit 70
- 199 W 2025 S Unit 34
- 0 Null Unit 25-263229
- 2105 Balboa Way Unit 15
- 284 W Sir Monte Dr
- 2150 Balboa Way Unit 9
- 300 W 2025 S Unit 26
- 2255 Hill Rd Unit 14
- 2159 Fairway Hills Dr Unit 40
- 2159 Fairway Hills Dr
- 2255 S Hill Unit 14
- 2244 Putters Cir
- 264 San Rafael Place
- 646 W Verde Ridge Rd
- 372 E Vermillion Ave
- 165 Dolce
- 0 W Dolce Cove
- 157 W Dolce Cove
- 204 Bella Viaggio Cove
- 170 W Dolce Cove
- 191 W Dolce Cove
- 152 W Dolce Cove
- 196 W Dolce Cove
- 204 W Bella Viaggio Cove
- 216 Bella Viaggio Cove
- 185 W Sir Monte Dr
- 205 W Dolce Cove
- 169 W Sir Monte Dr
- 231 W Sir Monte Dr
- 231 W Sir Monte Dr
- 231 W Sir Monte Dr Unit 16
- 231 W Sir Monte Dr Unit 16
- 188 W Sir Monte Dr
- 223 Golden Eagle
- 236 W Sir Monte Dr