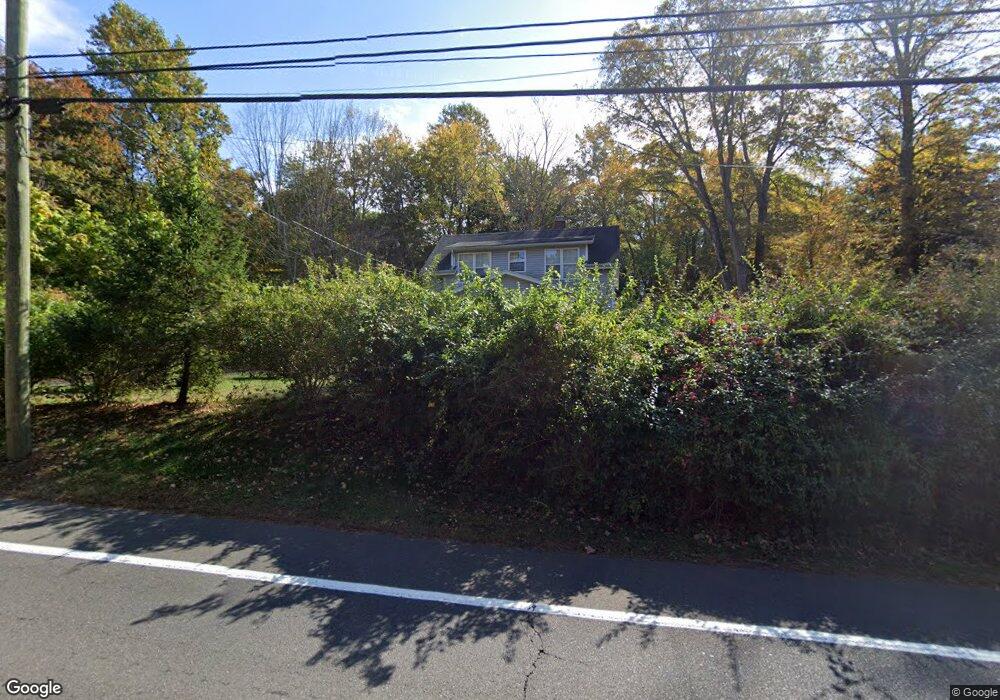
165 W High St East Hampton, CT 06424
Estimated Value: $313,601 - $378,000
2
Beds
2
Baths
1,200
Sq Ft
$287/Sq Ft
Est. Value
About This Home
This home is located at 165 W High St, East Hampton, CT 06424 and is currently estimated at $344,650, approximately $287 per square foot. 165 W High St is a home located in Middlesex County with nearby schools including Memorial School, Center Elementary School, and East Hampton Middle School.
Ownership History
Date
Name
Owned For
Owner Type
Purchase Details
Closed on
Aug 3, 2010
Sold by
Pare Allan A and Kerkow Gayle A
Bought by
Castelli Christopher R
Current Estimated Value
Home Financials for this Owner
Home Financials are based on the most recent Mortgage that was taken out on this home.
Original Mortgage
$204,250
Outstanding Balance
$136,658
Interest Rate
4.78%
Estimated Equity
$207,992
Purchase Details
Closed on
Jan 7, 2005
Sold by
Mather Michael James
Bought by
Pare Allan A and Kerkow Gayle A
Home Financials for this Owner
Home Financials are based on the most recent Mortgage that was taken out on this home.
Original Mortgage
$185,700
Interest Rate
5.75%
Purchase Details
Closed on
Nov 29, 2000
Sold by
Ligiori Thomas C
Bought by
Mather Michael J
Purchase Details
Closed on
Mar 16, 1994
Sold by
Murphy Dolores A Est
Bought by
Liquori Thomas C
Create a Home Valuation Report for This Property
The Home Valuation Report is an in-depth analysis detailing your home's value as well as a comparison with similar homes in the area
Home Values in the Area
Average Home Value in this Area
Purchase History
| Date | Buyer | Sale Price | Title Company |
|---|---|---|---|
| Castelli Christopher R | $215,000 | -- | |
| Castelli Christopher R | $215,000 | -- | |
| Pare Allan A | $229,900 | -- | |
| Pare Allan A | $229,900 | -- | |
| Mather Michael J | $143,000 | -- | |
| Mather Michael J | $143,000 | -- | |
| Liquori Thomas C | $30,000 | -- | |
| Liquori Thomas C | $30,000 | -- |
Source: Public Records
Mortgage History
| Date | Status | Borrower | Loan Amount |
|---|---|---|---|
| Open | Liquori Thomas C | $204,250 | |
| Closed | Liquori Thomas C | $204,250 | |
| Previous Owner | Liquori Thomas C | $185,700 |
Source: Public Records
Tax History
| Year | Tax Paid | Tax Assessment Tax Assessment Total Assessment is a certain percentage of the fair market value that is determined by local assessors to be the total taxable value of land and additions on the property. | Land | Improvement |
|---|---|---|---|---|
| 2025 | $4,984 | $125,520 | $38,810 | $86,710 |
| 2024 | $4,775 | $125,520 | $38,810 | $86,710 |
| 2023 | $4,526 | $125,520 | $38,810 | $86,710 |
| 2022 | $4,351 | $125,520 | $38,810 | $86,710 |
| 2021 | $4,334 | $125,520 | $38,810 | $86,710 |
| 2020 | $3,915 | $118,150 | $34,310 | $83,840 |
| 2019 | $3,766 | $113,650 | $36,760 | $76,890 |
| 2018 | $3,560 | $113,650 | $36,760 | $76,890 |
| 2017 | $3,560 | $113,650 | $36,760 | $76,890 |
| 2016 | $3,346 | $113,650 | $36,760 | $76,890 |
| 2015 | $3,633 | $130,760 | $46,860 | $83,900 |
| 2014 | $3,160 | $130,760 | $46,860 | $83,900 |
Source: Public Records
Map
Nearby Homes
Your Personal Tour Guide
Ask me questions while you tour the home.