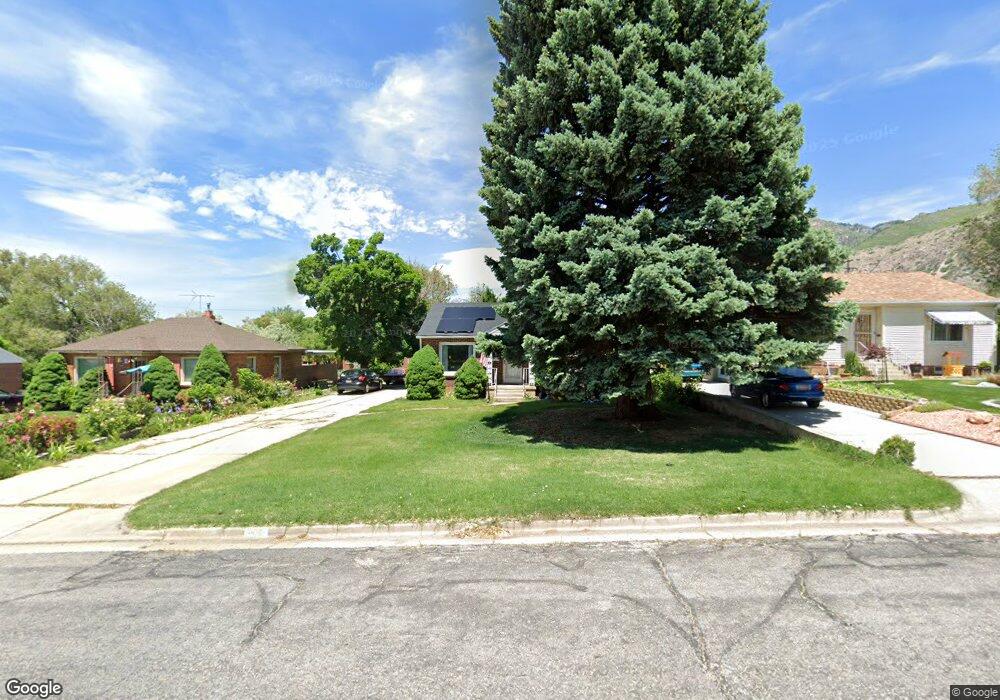
1650 21st St Ogden, UT 84401
East Bench NeighborhoodEstimated Value: $448,000 - $509,000
4
Beds
2
Baths
2,343
Sq Ft
$204/Sq Ft
Est. Value
About This Home
This home is located at 1650 21st St, Ogden, UT 84401 and is currently estimated at $478,502, approximately $204 per square foot. 1650 21st St is a home located in Weber County with nearby schools including Polk School, Mound Fort Junior High School, and Ogden High School.
Ownership History
Date
Name
Owned For
Owner Type
Purchase Details
Closed on
Mar 21, 2022
Sold by
Lauren Wallis
Bought by
Morris Annalee and Call Brett Wayne
Current Estimated Value
Home Financials for this Owner
Home Financials are based on the most recent Mortgage that was taken out on this home.
Original Mortgage
$449,595
Outstanding Balance
$421,186
Interest Rate
4.16%
Mortgage Type
New Conventional
Estimated Equity
$57,316
Purchase Details
Closed on
Jul 25, 2018
Sold by
Glenger Lauron and Wallis Lauren
Bought by
Wallis James S and Wallis Lauren
Purchase Details
Closed on
Feb 23, 2010
Sold by
Lindquist Carol Ann and Holley Richard Glen
Bought by
Christensen Justin Chris and Pfeifer Christensen Britt Adair
Home Financials for this Owner
Home Financials are based on the most recent Mortgage that was taken out on this home.
Original Mortgage
$147,283
Interest Rate
4.87%
Mortgage Type
FHA
Create a Home Valuation Report for This Property
The Home Valuation Report is an in-depth analysis detailing your home's value as well as a comparison with similar homes in the area
Home Values in the Area
Average Home Value in this Area
Purchase History
| Date | Buyer | Sale Price | Title Company |
|---|---|---|---|
| Morris Annalee | -- | Stewart Title Company | |
| Wallis James S | -- | None Available | |
| Christensen Justin Chris | -- | Bonneville Superior Title Co | |
| Christensen Justin Chris | -- | Bonneville Superior Title Co |
Source: Public Records
Mortgage History
| Date | Status | Borrower | Loan Amount |
|---|---|---|---|
| Open | Morris Annalee | $449,595 | |
| Previous Owner | Christensen Justin Chris | $147,283 |
Source: Public Records
Tax History
| Year | Tax Paid | Tax Assessment Tax Assessment Total Assessment is a certain percentage of the fair market value that is determined by local assessors to be the total taxable value of land and additions on the property. | Land | Improvement |
|---|---|---|---|---|
| 2025 | $3,352 | $436,402 | $128,766 | $307,636 |
| 2024 | $3,313 | $234,299 | $70,821 | $163,478 |
| 2023 | $3,168 | $226,600 | $64,526 | $162,074 |
| 2022 | $3,476 | $254,100 | $53,466 | $200,634 |
| 2021 | $2,710 | $321,000 | $62,133 | $258,867 |
| 2020 | $2,511 | $273,000 | $46,633 | $226,367 |
| 2019 | $2,421 | $246,000 | $41,694 | $204,306 |
| 2018 | $2,270 | $228,000 | $34,602 | $193,398 |
| 2017 | $2,129 | $198,000 | $34,602 | $163,398 |
| 2016 | $2,163 | $109,388 | $17,048 | $92,340 |
| 2015 | $1,700 | $81,028 | $17,048 | $63,980 |
| 2014 | $1,597 | $74,673 | $17,048 | $57,625 |
Source: Public Records
Map
Nearby Homes
- 1555 Rushton St
- 1660 Dunsinane Cir
- 2150 Fillmore Ave
- 1670 Swan St
- 2084 Robins Ave
- 2170 Polk Ave
- 1425 E 22nd St
- 1436 Swan St
- 1757 Cahoon St
- 1312 E 2025 S
- 1314 E 1990 S Unit 24
- 1323 E 22nd St
- 1702 Capitol St
- 1554 Capitol St
- 1284 E 22nd St
- 1255 Valley Dr Unit 2
- 1380 24th St
- 2337 Custer Ave
- 1402 Capitol St
- 2102 S Harrison Blvd
Your Personal Tour Guide
Ask me questions while you tour the home.