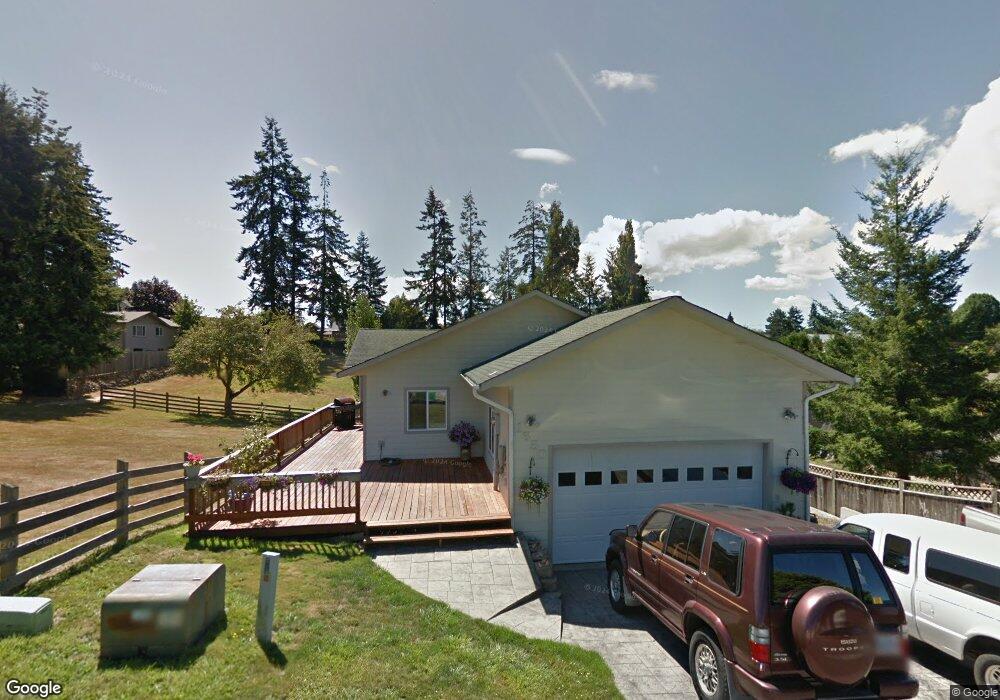
1650 Apple Dr Myrtle Point, OR 97458
Estimated Value: $394,000 - $435,099
3
Beds
2
Baths
2,563
Sq Ft
$162/Sq Ft
Est. Value
About This Home
This home is located at 1650 Apple Dr, Myrtle Point, OR 97458 and is currently estimated at $414,550, approximately $161 per square foot. 1650 Apple Dr is a home located in Coos County with nearby schools including Myrtle Crest School and Myrtle Point High School.
Ownership History
Date
Name
Owned For
Owner Type
Purchase Details
Closed on
Aug 12, 2024
Sold by
Wilson Johnny Randel
Bought by
Wilson Johnny Randal and Wilson Maritza
Current Estimated Value
Purchase Details
Closed on
Jul 27, 2016
Sold by
Kirkpatrick Christopher and Kirkpatrick Nicole
Bought by
Wilson Johnny R and Wilson Sherry L
Home Financials for this Owner
Home Financials are based on the most recent Mortgage that was taken out on this home.
Original Mortgage
$180,500
Interest Rate
3.54%
Mortgage Type
VA
Create a Home Valuation Report for This Property
The Home Valuation Report is an in-depth analysis detailing your home's value as well as a comparison with similar homes in the area
Home Values in the Area
Average Home Value in this Area
Purchase History
| Date | Buyer | Sale Price | Title Company |
|---|---|---|---|
| Wilson Johnny Randal | -- | None Listed On Document | |
| Wilson Johnny R | -- | None Listed On Document | |
| Wilson Johnny R | $220,000 | Ticor Title Insurance |
Source: Public Records
Mortgage History
| Date | Status | Borrower | Loan Amount |
|---|---|---|---|
| Previous Owner | Wilson Johnny R | $180,500 |
Source: Public Records
Tax History
| Year | Tax Paid | Tax Assessment Tax Assessment Total Assessment is a certain percentage of the fair market value that is determined by local assessors to be the total taxable value of land and additions on the property. | Land | Improvement |
|---|---|---|---|---|
| 2025 | $4,471 | $269,680 | -- | -- |
| 2024 | $4,396 | $261,830 | -- | -- |
| 2023 | $4,194 | $254,210 | $0 | $0 |
| 2022 | $4,128 | $246,810 | $0 | $0 |
| 2021 | $4,022 | $239,630 | $0 | $0 |
| 2020 | $3,910 | $239,630 | $0 | $0 |
| 2019 | $3,740 | $225,890 | $0 | $0 |
| 2018 | $3,637 | $219,320 | $0 | $0 |
| 2017 | $3,542 | $212,940 | $0 | $0 |
| 2016 | $3,441 | $206,740 | $0 | $0 |
| 2015 | $3,395 | $200,720 | $0 | $0 |
| 2014 | $3,340 | $194,880 | $0 | $0 |
Source: Public Records
Map
Nearby Homes
- 1829 E Willow St
- 536 18th St
- 1932 Willow St
- 227 Border St
- 618/620 Spruce St
- 1211 Fairview St
- 0 Sitkum Ln Unit 300
- 1404 Harris St
- 1005 Maple St
- 805 C St
- 1783 View St
- 0 Roseburg Rd Unit 601
- 1715 20th St
- 1753 20th St
- 2031 Kincheloe Ln
- 1985 Roseburg Rd
- 54124 Old Broadbent Rd
- 0 Pleasant Valley Rd Unit 22531177
- 94263 Matheny Creek Ln
- 94104 Pleasant Valley Ln
Your Personal Tour Guide
Ask me questions while you tour the home.