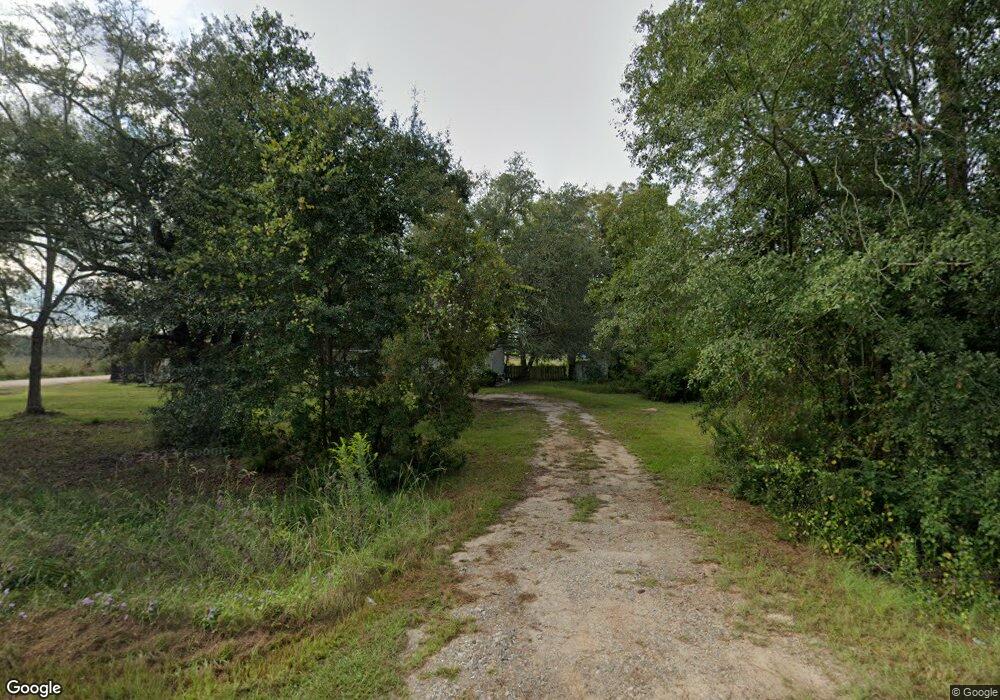
1650 Axson Rd Pearson, GA 31642
Estimated Value: $93,000 - $201,000
Studio
--
Bath
2,192
Sq Ft
$72/Sq Ft
Est. Value
About This Home
This home is located at 1650 Axson Rd, Pearson, GA 31642 and is currently estimated at $156,932, approximately $71 per square foot. 1650 Axson Rd is a home with nearby schools including Pearson Elementary School, Willacoochee Elementary School, and Atkinson County High School.
Ownership History
Date
Name
Owned For
Owner Type
Purchase Details
Closed on
Oct 11, 2022
Sold by
Deleon Luis Antonio
Bought by
Longoria Maria Delos Angeles
Current Estimated Value
Purchase Details
Closed on
Oct 1, 2020
Sold by
Chaney Jack W
Bought by
Deleon Luis Antonio
Home Financials for this Owner
Home Financials are based on the most recent Mortgage that was taken out on this home.
Original Mortgage
$80,000
Interest Rate
2.9%
Mortgage Type
New Conventional
Purchase Details
Closed on
Nov 15, 2006
Sold by
Chaney Jack W
Bought by
Chaney Karla Y
Purchase Details
Closed on
May 22, 2003
Sold by
Reuber Juanita M
Bought by
Chaney Jack
Purchase Details
Closed on
Aug 6, 1982
Bought by
Reuber Juanita M
Create a Home Valuation Report for This Property
The Home Valuation Report is an in-depth analysis detailing your home's value as well as a comparison with similar homes in the area
Purchase History
| Date | Buyer | Sale Price | Title Company |
|---|---|---|---|
| Longoria Maria Delos Angeles | $11,000 | -- | |
| Filigrana Cifuentes Walter | $11,000 | -- | |
| Longoria Corrales Ricardo | $11,000 | -- | |
| Turrubiartes Teodoro Delgado | $11,000 | -- | |
| Garcia Ismael Garcia | $11,000 | -- | |
| Deleon Luis Antonio | $100,000 | -- | |
| Chaney Karla Y | -- | -- | |
| Chaney Jack | $75,000 | -- | |
| Reuber Juanita M | -- | -- |
Source: Public Records
Mortgage History
| Date | Status | Borrower | Loan Amount |
|---|---|---|---|
| Previous Owner | Deleon Luis Antonio | $80,000 |
Source: Public Records
Tax History
| Year | Tax Paid | Tax Assessment Tax Assessment Total Assessment is a certain percentage of the fair market value that is determined by local assessors to be the total taxable value of land and additions on the property. | Land | Improvement |
|---|---|---|---|---|
| 2024 | $1,230 | $40,230 | $10,883 | $29,347 |
| 2023 | $1,025 | $33,525 | $10,883 | $22,642 |
| 2022 | $1,129 | $37,091 | $14,449 | $22,642 |
| 2021 | $1,191 | $37,091 | $14,449 | $22,642 |
| 2020 | $1,192 | $37,091 | $14,449 | $22,642 |
| 2019 | $1,193 | $37,091 | $14,449 | $22,642 |
| 2018 | $1,199 | $37,091 | $14,449 | $22,642 |
| 2017 | $1,193 | $37,091 | $14,449 | $22,642 |
| 2016 | $1,193 | $37,091 | $14,449 | $22,642 |
| 2015 | -- | $37,090 | $14,449 | $22,642 |
| 2014 | -- | $37,091 | $14,449 | $22,642 |
Source: Public Records
Map
Nearby Homes
- 74 Pearson St
- 00 Us-441 S
- 0 Honeysuckle Ln Unit 10623320
- 0 Mount Zion Church Rd
- 144 Heidi Ln
- 0 Doc Sutton Rd
- 129 Hoot Owl Ln Unit 1
- 6436 Old Axson Rd
- 389 Pine Valley Rd
- 1757 Logan Dr
- 166 Tempa Ln
- 00
- 8708 Cogdell Hwy
- 380 Brookewood Dr
- 569 Bobcat Trail
- 79 Joyce Dr
- 3236 Baymeadows Dr W
- 2987 Baymeadows Dr W
- 2828 Baymeadows Dr W
- 2831 Baymeadows Dr W
Your Personal Tour Guide
Ask me questions while you tour the home.