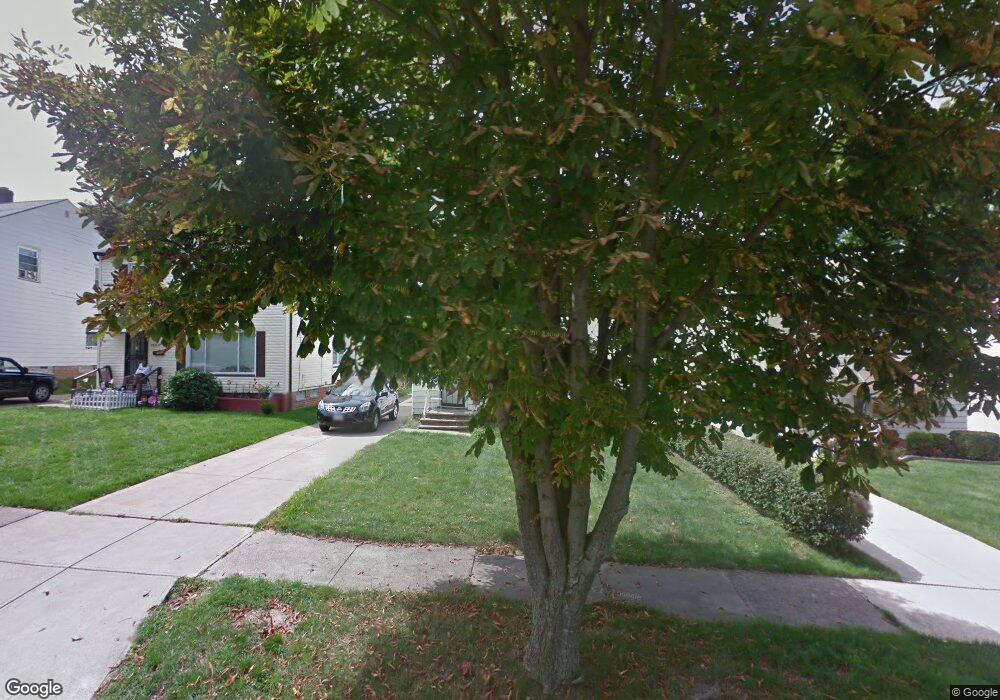
1650 E 243rd St Euclid, OH 44117
Estimated Value: $135,000 - $150,000
3
Beds
1
Bath
1,152
Sq Ft
$124/Sq Ft
Est. Value
About This Home
This home is located at 1650 E 243rd St, Euclid, OH 44117 and is currently estimated at $142,728, approximately $123 per square foot. 1650 E 243rd St is a home located in Cuyahoga County with nearby schools including Thomas Jefferson Elementary School, Euclid Middle School, and Euclid High School.
Ownership History
Date
Name
Owned For
Owner Type
Purchase Details
Closed on
May 26, 2005
Sold by
Williamson Austin Felicia and Austin Felicia
Bought by
Sorrell Tammie K
Current Estimated Value
Home Financials for this Owner
Home Financials are based on the most recent Mortgage that was taken out on this home.
Original Mortgage
$80,000
Outstanding Balance
$43,400
Interest Rate
7%
Mortgage Type
Fannie Mae Freddie Mac
Estimated Equity
$99,328
Purchase Details
Closed on
Nov 17, 2000
Sold by
Austin Nathan E
Bought by
Austin Felicia
Purchase Details
Closed on
Dec 8, 1989
Sold by
Kevern Thomas C and Kevern Mary M
Bought by
Williamson- Austin Felicia
Purchase Details
Closed on
Apr 3, 1985
Sold by
Kevern Thomas C
Bought by
Kevern Thomas C and Kevern Mary M
Purchase Details
Closed on
Jan 14, 1976
Sold by
Patterson Eleanor
Bought by
Kevern Thomas C
Purchase Details
Closed on
Jan 1, 1975
Bought by
Patterson Eleanor
Create a Home Valuation Report for This Property
The Home Valuation Report is an in-depth analysis detailing your home's value as well as a comparison with similar homes in the area
Home Values in the Area
Average Home Value in this Area
Purchase History
| Date | Buyer | Sale Price | Title Company |
|---|---|---|---|
| Sorrell Tammie K | $100,000 | Executive Title Agency | |
| Austin Felicia | -- | -- | |
| Williamson- Austin Felicia | $64,900 | -- | |
| Kevern Thomas C | -- | -- | |
| Kevern Thomas C | $30,000 | -- | |
| Patterson Eleanor | -- | -- |
Source: Public Records
Mortgage History
| Date | Status | Borrower | Loan Amount |
|---|---|---|---|
| Open | Sorrell Tammie K | $80,000 | |
| Closed | Sorrell Tammie K | $20,000 |
Source: Public Records
Tax History
| Year | Tax Paid | Tax Assessment Tax Assessment Total Assessment is a certain percentage of the fair market value that is determined by local assessors to be the total taxable value of land and additions on the property. | Land | Improvement |
|---|---|---|---|---|
| 2025 | $3,144 | $47,180 | $8,680 | $38,500 |
| 2024 | $3,242 | $47,180 | $8,680 | $38,500 |
| 2023 | $2,707 | $31,190 | $6,790 | $24,400 |
| 2022 | $2,646 | $31,190 | $6,790 | $24,400 |
| 2021 | $2,946 | $31,190 | $6,790 | $24,400 |
| 2020 | $2,794 | $26,880 | $5,850 | $21,040 |
| 2019 | $2,512 | $76,800 | $16,700 | $60,100 |
| 2018 | $2,536 | $26,880 | $5,850 | $21,040 |
| 2017 | $2,671 | $23,670 | $4,660 | $19,010 |
| 2016 | $2,677 | $23,670 | $4,660 | $19,010 |
| 2015 | $2,664 | $23,670 | $4,660 | $19,010 |
| 2014 | $2,664 | $23,670 | $4,660 | $19,010 |
Source: Public Records
Map
Nearby Homes
- 24691 Hawthorne Dr
- 25031 Glenbrook Blvd
- 1979 Idlehurst Dr
- 24991 Euclid Ave
- 1934 Beverly Hills Dr
- 25550 Glenbrook Blvd
- 25641 Glenbrook Blvd
- 25161 Euclid Ave
- 23501 Effingham Blvd
- 1552 E 254th St
- 1790 Skyline Dr
- 1530 E 254th St
- 1437 E 252nd St
- 24105 Chardon Rd
- 1807 Skyline Dr
- 1775 Sherwood Blvd
- 1765 E 238th St
- 1754 E 236th St
- 1471 Hall Ct
- 145 Richmond Rd
- 1660 E 243rd St
- 1644 E 243rd St
- 1670 E 243rd St
- 1640 E 243rd St
- VL E 243rd St
- 1674 E 243rd St
- 1630 E 243rd St
- 24350 Hawthorne Dr
- 24150 Euclid Ave
- 1676 E 243rd St
- 24401 Elsmere Dr
- 24370 Hawthorne Dr
- 1620 E 243rd St
- 1680 E 243rd St
- 24431 Elsmere Dr
- 1631 E 243rd St
- 24400 Hawthorne Dr
- 1684 E 243rd St
- 24270 E 243rd St
- 24451 Elsmere Dr
Your Personal Tour Guide
Ask me questions while you tour the home.