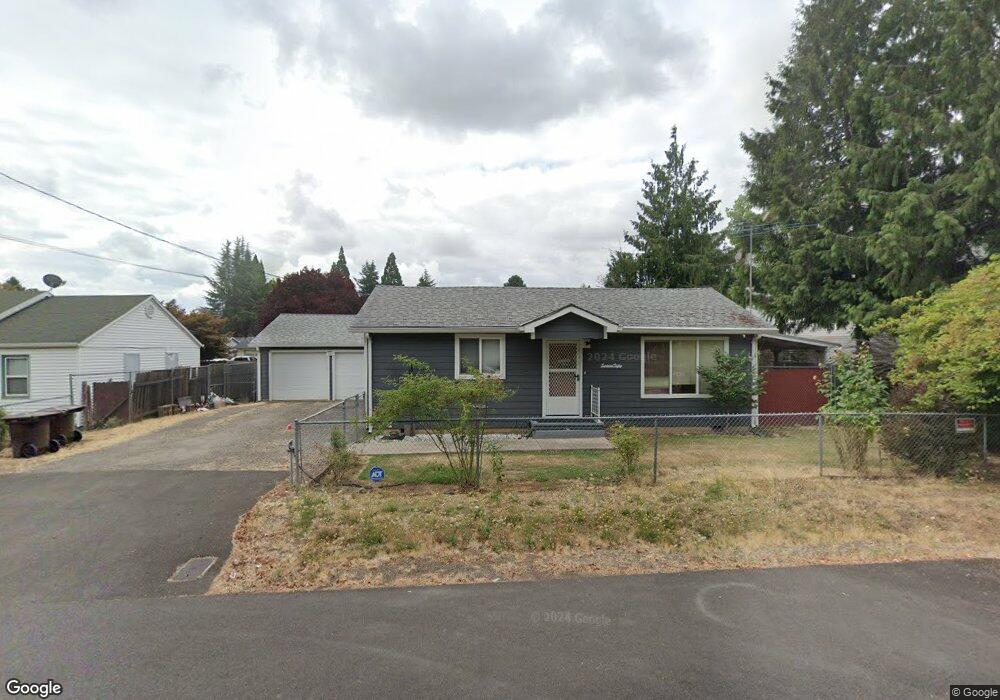
1650 SE Maple Ct Hillsboro, OR 97123
Central Hillsboro NeighborhoodEstimated Value: $352,000 - $408,000
2
Beds
1
Bath
888
Sq Ft
$432/Sq Ft
Est. Value
About This Home
This home is located at 1650 SE Maple Ct, Hillsboro, OR 97123 and is currently estimated at $383,364, approximately $431 per square foot. 1650 SE Maple Ct is a home located in Washington County with nearby schools including W.L. Henry Elementary School, South Meadows Middle School, and Hillsboro High School.
Ownership History
Date
Name
Owned For
Owner Type
Purchase Details
Closed on
Sep 28, 2005
Sold by
Coffman Clayton D and Coffman Annie R
Bought by
Risley Duane A and Risley Annie L
Current Estimated Value
Home Financials for this Owner
Home Financials are based on the most recent Mortgage that was taken out on this home.
Original Mortgage
$169,000
Outstanding Balance
$96,239
Interest Rate
6.79%
Mortgage Type
Fannie Mae Freddie Mac
Estimated Equity
$287,125
Purchase Details
Closed on
Aug 29, 2002
Sold by
Player Mark E and Player Trisha L
Bought by
Coffman Clayton D and Coffman Annie R
Home Financials for this Owner
Home Financials are based on the most recent Mortgage that was taken out on this home.
Original Mortgage
$125,000
Interest Rate
6.43%
Purchase Details
Closed on
Jul 31, 1996
Sold by
Harris Dorothy P
Bought by
Player Mark E and Smith Trisha L
Home Financials for this Owner
Home Financials are based on the most recent Mortgage that was taken out on this home.
Original Mortgage
$94,632
Interest Rate
8.32%
Mortgage Type
FHA
Create a Home Valuation Report for This Property
The Home Valuation Report is an in-depth analysis detailing your home's value as well as a comparison with similar homes in the area
Home Values in the Area
Average Home Value in this Area
Purchase History
| Date | Buyer | Sale Price | Title Company |
|---|---|---|---|
| Risley Duane A | $169,000 | Fidelity Natl Title Co Of Or | |
| Coffman Clayton D | $129,000 | Fidelity National Title Co | |
| Player Mark E | $94,900 | Chicago Title |
Source: Public Records
Mortgage History
| Date | Status | Borrower | Loan Amount |
|---|---|---|---|
| Open | Risley Duane A | $169,000 | |
| Previous Owner | Coffman Clayton D | $125,000 | |
| Previous Owner | Player Mark E | $94,632 |
Source: Public Records
Tax History Compared to Growth
Tax History
| Year | Tax Paid | Tax Assessment Tax Assessment Total Assessment is a certain percentage of the fair market value that is determined by local assessors to be the total taxable value of land and additions on the property. | Land | Improvement |
|---|---|---|---|---|
| 2025 | $2,340 | $143,150 | -- | -- |
| 2024 | $2,274 | $138,990 | -- | -- |
| 2023 | $2,274 | $134,950 | $0 | $0 |
| 2022 | $2,212 | $134,950 | $0 | $0 |
| 2021 | $2,168 | $127,210 | $0 | $0 |
| 2020 | $2,121 | $123,510 | $0 | $0 |
| 2019 | $2,060 | $119,920 | $0 | $0 |
| 2018 | $1,972 | $116,430 | $0 | $0 |
| 2017 | $1,900 | $113,040 | $0 | $0 |
| 2016 | $1,848 | $109,750 | $0 | $0 |
| 2015 | $1,774 | $106,560 | $0 | $0 |
| 2014 | $1,764 | $103,460 | $0 | $0 |
Source: Public Records
Map
Nearby Homes
- 0 SE Cedar St
- 349 SE Walnut St
- 656 Brauner Place
- 875 SE 13th Ave
- 1180 SE Maple St
- 1687 SE Spruce St
- 1518 SE Oak St Unit 2
- 785 SE 21st Ave
- 439 SE 24th Ave
- 913 SE Handel Place
- 1112 SE Alika Ave
- 995 SE Albertine St
- 953 SE Albertine St
- 844 SE Cedar St
- 1179 SE Leander St
- 1112 E Main St
- 918 SE Marinette Ave
- 1034 SE Bacarra St
- 1143 SE Bianca St
- 957 SE Marinette Ave
- 1670 SE Maple Ct
- 1655 SE Maple Ct
- 1630 SE Maple St
- 1657 SE Maple Ct
- 1652 SE Maple St
- 1605 SE Maple St
- 1679 SE Maple Ct
- 1676 SE Maple St Unit 1
- 1676 SE Maple St
- 730 SE 16th Ave
- 1730 SE Maple Ct
- 1663 SE Maple Ct
- 1685 SE Sussex Ct
- 1669 SE Maple Ct
- 1651 SE Sussex Ct
- 1724 SE Maple St
- 715 SE 16th Ave
- 740 SE 16th Ave
- 1711 SE Sussex Ct
- 1740 SE Maple Ct