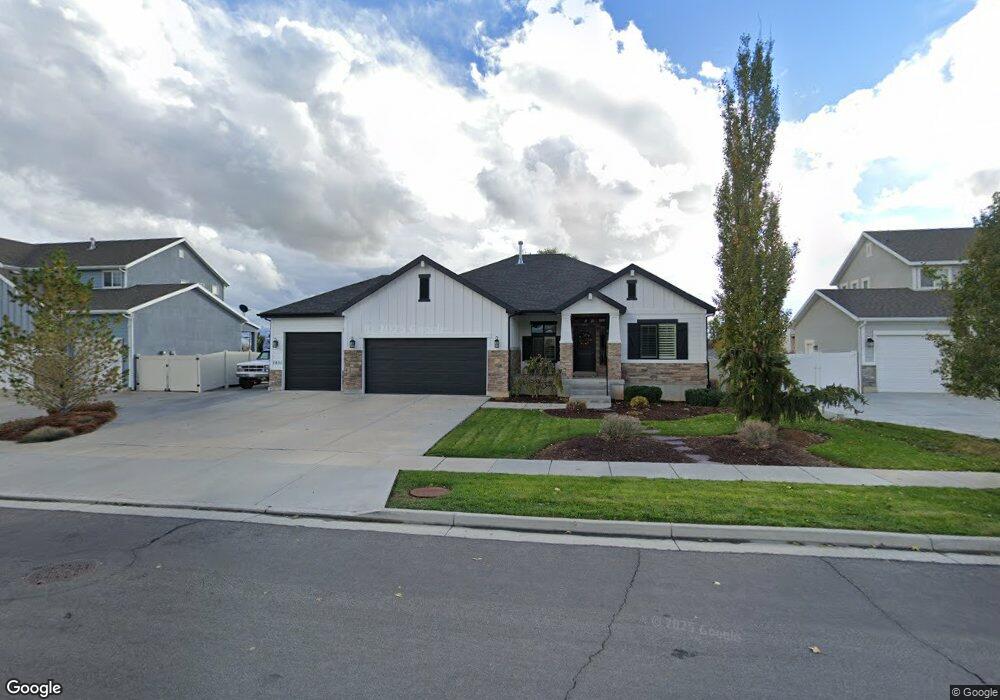
1651 W 75 N Layton, UT 84041
Estimated Value: $645,000 - $754,000
5
Beds
3
Baths
1,715
Sq Ft
$411/Sq Ft
Est. Value
About This Home
This home is located at 1651 W 75 N, Layton, UT 84041 and is currently estimated at $704,313, approximately $410 per square foot. 1651 W 75 N is a home located in Davis County with nearby schools including Ellison Park School, Shoreline Junior High School, and Layton High School.
Ownership History
Date
Name
Owned For
Owner Type
Purchase Details
Closed on
Nov 7, 2020
Sold by
Romero Shaun and Romero Jennifer Laine
Bought by
Romero Shaun and Romero Jennifer
Current Estimated Value
Purchase Details
Closed on
Dec 1, 2010
Sold by
Pinehurst 2009 Llc
Bought by
Romero Shaun and Romero Jennifer
Home Financials for this Owner
Home Financials are based on the most recent Mortgage that was taken out on this home.
Original Mortgage
$282,753
Outstanding Balance
$185,603
Interest Rate
4.17%
Mortgage Type
New Conventional
Estimated Equity
$518,710
Purchase Details
Closed on
Nov 20, 2009
Sold by
Symphony Homes Llc
Bought by
Pinehurst 2009 Llc
Home Financials for this Owner
Home Financials are based on the most recent Mortgage that was taken out on this home.
Original Mortgage
$1,630,000
Interest Rate
4.88%
Mortgage Type
Credit Line Revolving
Purchase Details
Closed on
Mar 25, 2008
Sold by
Symphony Development Corp
Bought by
Symphony Homes Llc
Home Financials for this Owner
Home Financials are based on the most recent Mortgage that was taken out on this home.
Original Mortgage
$2,250,000
Interest Rate
5.72%
Mortgage Type
Construction
Create a Home Valuation Report for This Property
The Home Valuation Report is an in-depth analysis detailing your home's value as well as a comparison with similar homes in the area
Home Values in the Area
Average Home Value in this Area
Purchase History
| Date | Buyer | Sale Price | Title Company |
|---|---|---|---|
| Romero Shaun | -- | None Available | |
| Romero Shaun | -- | Bonneville Superior Title Co | |
| Pinehurst 2009 Llc | -- | Bonneville Superior Tit | |
| Symphony Homes Llc | -- | Bonneville Superior Title Co |
Source: Public Records
Mortgage History
| Date | Status | Borrower | Loan Amount |
|---|---|---|---|
| Open | Romero Shaun | $282,753 | |
| Previous Owner | Pinehurst 2009 Llc | $1,630,000 | |
| Previous Owner | Symphony Homes Llc | $2,250,000 |
Source: Public Records
Tax History Compared to Growth
Tax History
| Year | Tax Paid | Tax Assessment Tax Assessment Total Assessment is a certain percentage of the fair market value that is determined by local assessors to be the total taxable value of land and additions on the property. | Land | Improvement |
|---|---|---|---|---|
| 2025 | $3,339 | $366,300 | $141,133 | $225,167 |
| 2024 | $3,339 | $353,100 | $149,217 | $203,883 |
| 2023 | $3,235 | $603,000 | $161,792 | $441,208 |
| 2022 | $3,434 | $347,600 | $91,676 | $255,924 |
| 2021 | $3,028 | $457,000 | $137,474 | $319,526 |
| 2020 | $2,755 | $399,000 | $118,151 | $280,849 |
| 2019 | $2,778 | $394,000 | $115,107 | $278,893 |
| 2018 | $2,570 | $366,000 | $101,623 | $264,377 |
| 2016 | $2,545 | $186,945 | $43,092 | $143,853 |
| 2015 | $2,460 | $171,545 | $43,092 | $128,453 |
| 2014 | $2,027 | $144,558 | $43,092 | $101,466 |
| 2013 | -- | $149,014 | $43,044 | $105,970 |
Source: Public Records
Map
Nearby Homes
- 163 Cold Creek Way
- 37 N Swift Creek Dr
- 1606 W 200 N
- Trio Plan at Amber Fields
- Treble Plan at Amber Fields
- Timpani Plan at Amber Fields
- Tenor Plan at Amber Fields
- Tempo Plan at Amber Fields
- Rhapsody Plan at Amber Fields
- Prelude Plan at Amber Fields
- Octave Plan at Amber Fields
- Libby Plan at Amber Fields
- Interlude Plan at Amber Fields
- Harvard Plan at Amber Fields
- Harrison Plan at Amber Fields
- Fortissimo Plan at Amber Fields
- Forte Plan at Amber Fields
- Finale Plan at Amber Fields
- Concerto Plan at Amber Fields
- Capitol Plan at Amber Fields
- 1635 W 75 N
- 1673 W 75 N
- 1685 W 75 N Unit 1
- 1685 W 75 N
- 1650 W Gentile St
- 1636 W Gentile St
- 1654 W 75 N
- 1636 W 75 N
- 1680 W Gentile St
- 1607 W 75 N
- 1620 W 75 N
- 1582 W Gentile St
- 103 N 1675 W
- 55 Cold Creek Way
- 35 Cold Creek Way
- 1608 W 75 N
- 1583 W 75 N Unit 6
- 1655 W 150 N Unit 12
- 1639 W 150 N
- 1625 W 150 N