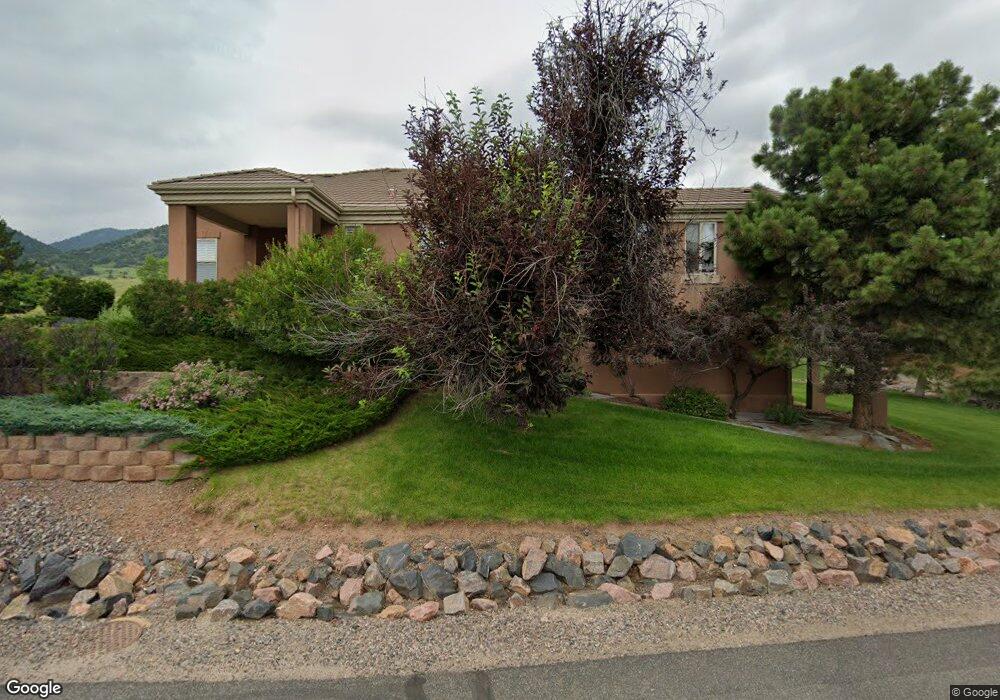
16510 Red Cliff Cir Morrison, CO 80465
Willow Springs NeighborhoodEstimated Value: $1,240,437 - $1,429,000
3
Beds
5
Baths
1,983
Sq Ft
$679/Sq Ft
Est. Value
About This Home
This home is located at 16510 Red Cliff Cir, Morrison, CO 80465 and is currently estimated at $1,345,859, approximately $678 per square foot. 16510 Red Cliff Cir is a home located in Jefferson County with nearby schools including Red Rocks Elementary School, Carmody Middle School, and Bear Creek High School.
Ownership History
Date
Name
Owned For
Owner Type
Purchase Details
Closed on
Jul 13, 2017
Sold by
Cappelli Patricia C
Bought by
Patricia C Cappelli Trust
Current Estimated Value
Purchase Details
Closed on
Dec 27, 2016
Sold by
Russell Judy A
Bought by
Cappelli Patricia C
Purchase Details
Closed on
Jan 4, 2006
Sold by
Doherty Edward K and Doherty Mary Ann
Bought by
Russell Judy A
Home Financials for this Owner
Home Financials are based on the most recent Mortgage that was taken out on this home.
Original Mortgage
$275,000
Interest Rate
6.23%
Mortgage Type
Fannie Mae Freddie Mac
Purchase Details
Closed on
Oct 30, 1998
Sold by
Larsen Homes Ltd
Bought by
Doherty Edward K and Doherty Mary Ann
Home Financials for this Owner
Home Financials are based on the most recent Mortgage that was taken out on this home.
Original Mortgage
$280,000
Interest Rate
6.57%
Create a Home Valuation Report for This Property
The Home Valuation Report is an in-depth analysis detailing your home's value as well as a comparison with similar homes in the area
Home Values in the Area
Average Home Value in this Area
Purchase History
| Date | Buyer | Sale Price | Title Company |
|---|---|---|---|
| Patricia C Cappelli Trust | -- | None Available | |
| Cappelli Patricia C | $770,000 | Homestead Title And Escrow | |
| Russell Judy A | $575,000 | Vanguard | |
| Doherty Edward K | $353,353 | First American Heritage Titl |
Source: Public Records
Mortgage History
| Date | Status | Borrower | Loan Amount |
|---|---|---|---|
| Previous Owner | Russell Judy A | $275,000 | |
| Previous Owner | Doherty Edward K | $280,000 |
Source: Public Records
Tax History Compared to Growth
Tax History
| Year | Tax Paid | Tax Assessment Tax Assessment Total Assessment is a certain percentage of the fair market value that is determined by local assessors to be the total taxable value of land and additions on the property. | Land | Improvement |
|---|---|---|---|---|
| 2024 | $7,508 | $67,760 | $18,844 | $48,916 |
| 2023 | $7,508 | $67,760 | $18,844 | $48,916 |
| 2022 | $6,273 | $52,687 | $14,904 | $37,783 |
| 2021 | $6,360 | $54,203 | $15,333 | $38,870 |
| 2020 | $5,752 | $49,118 | $12,377 | $36,741 |
| 2019 | $5,695 | $49,118 | $12,377 | $36,741 |
| 2018 | $5,347 | $44,862 | $12,375 | $32,487 |
| 2017 | $4,951 | $44,862 | $12,375 | $32,487 |
| 2016 | $5,579 | $47,968 | $12,403 | $35,565 |
| 2015 | $5,128 | $47,968 | $12,403 | $35,565 |
| 2014 | $5,128 | $40,667 | $11,104 | $29,563 |
Source: Public Records
Map
Nearby Homes
- 16601 Red Cliff Cir
- 16324 River Haven Way
- 16096 Double Eagle Dr Unit B
- 16223 Red Deer Ct
- 17121 Snow Creek Ln
- 15906 Double Eagle Dr
- 16939 Long Winding Rd
- 5569 Willow Springs Dr
- 16989 Long Winding Rd
- 16066 Ridge Tee Dr
- 15789 Sandtrap Way
- 16979 Lost Winding Rd
- 17106 Lost Horse Ln
- 17186 Lost Horse Ln
- 15480 Dinosaur Ridge Rd
- 15191 Dinosaur Ridge Rd
- 6170 Falcon Ridge Way
- 16653 Golden Rod Ln
- 6155 Meadowbrook Dr
- 6227 Colorow Dr
- 16500 Red Cliff Cir
- 16521 Red Cliff Cir
- 5461 Windsong Ct
- 5460 Windsong Ct
- 16451 Quail Ridge Ct
- 5450 Windsong Ct
- 5441 Windsong Ct
- 16461 Quail Ridge Ct
- 5440 Windsong Ct
- 16581 Red Cliff Cir
- 0000 Red Cliff Cir
- 16441 Quail Ridge Ct
- 16580 Red Cliff Cir
- 5439 Southwind Ct
- 16591 Red Cliff Cir
- 5438 Southwind Ct
- 16590 Red Cliff Cir
- 16431 Quail Ridge Ct
- 5429 Southwind Ct
- 16600 Red Cliff Cir