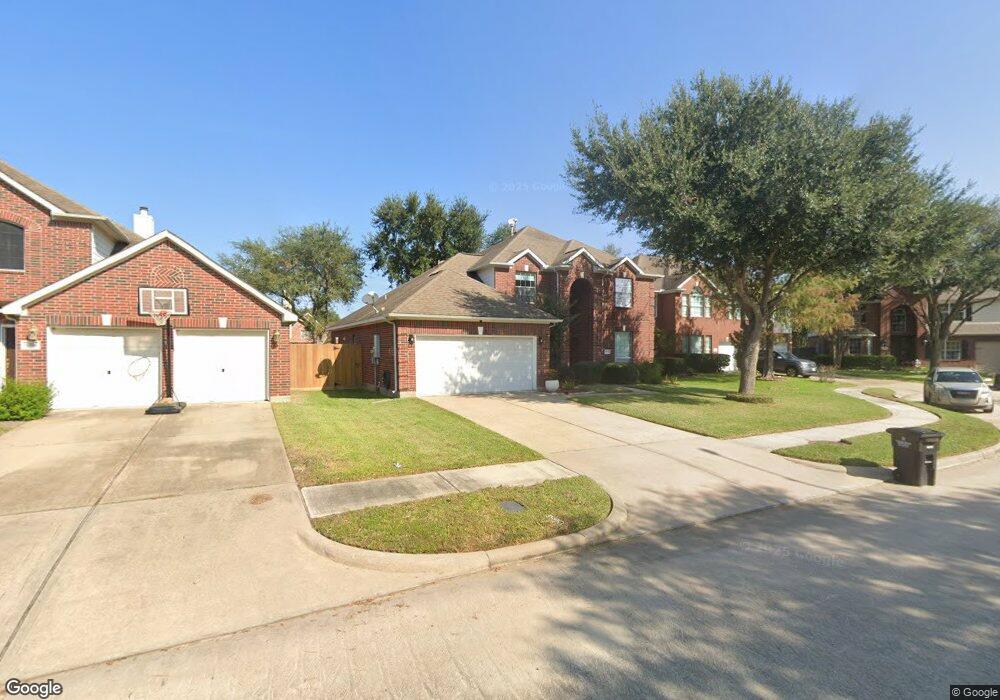
16510 Wheatmill Ct Houston, TX 77095
Copperfield NeighborhoodEstimated Value: $309,072 - $342,000
4
Beds
3
Baths
2,475
Sq Ft
$132/Sq Ft
Est. Value
About This Home
This home is located at 16510 Wheatmill Ct, Houston, TX 77095 and is currently estimated at $325,518, approximately $131 per square foot. 16510 Wheatmill Ct is a home located in Harris County with nearby schools including Lowery Elementary School, Aragon Middle School, and Langham Creek High School.
Ownership History
Date
Name
Owned For
Owner Type
Purchase Details
Closed on
Dec 12, 2020
Sold by
Sadr Seidsiamak and Vahedihaftcheshmeh Nasrin
Bought by
Sadr Siamak and Vahedi Nasrin
Current Estimated Value
Purchase Details
Closed on
Apr 30, 2015
Sold by
Babcock Jona K and Babcock Darrell
Bought by
Sadr Seidsiamak and Vahedihaftcheshmeh Nasrin
Home Financials for this Owner
Home Financials are based on the most recent Mortgage that was taken out on this home.
Original Mortgage
$164,800
Outstanding Balance
$127,232
Interest Rate
3.74%
Mortgage Type
New Conventional
Estimated Equity
$198,286
Purchase Details
Closed on
Jul 26, 2002
Sold by
Gateway Homes Ltd
Bought by
Babcock Jona K
Home Financials for this Owner
Home Financials are based on the most recent Mortgage that was taken out on this home.
Original Mortgage
$127,040
Interest Rate
6.62%
Create a Home Valuation Report for This Property
The Home Valuation Report is an in-depth analysis detailing your home's value as well as a comparison with similar homes in the area
Home Values in the Area
Average Home Value in this Area
Purchase History
| Date | Buyer | Sale Price | Title Company |
|---|---|---|---|
| Sadr Siamak | -- | None Available | |
| Sadr Seidsiamak | -- | None Available | |
| Babcock Jona K | -- | Houston Title Co |
Source: Public Records
Mortgage History
| Date | Status | Borrower | Loan Amount |
|---|---|---|---|
| Open | Sadr Seidsiamak | $164,800 | |
| Previous Owner | Babcock Jona K | $127,040 | |
| Closed | Babcock Jona K | $23,820 |
Source: Public Records
Tax History Compared to Growth
Tax History
| Year | Tax Paid | Tax Assessment Tax Assessment Total Assessment is a certain percentage of the fair market value that is determined by local assessors to be the total taxable value of land and additions on the property. | Land | Improvement |
|---|---|---|---|---|
| 2025 | $4,706 | $289,329 | $64,046 | $225,283 |
| 2024 | $4,706 | $287,969 | $64,046 | $223,923 |
| 2023 | $4,706 | $310,131 | $64,046 | $246,085 |
| 2022 | $6,838 | $307,048 | $42,580 | $264,468 |
| 2021 | $6,576 | $228,270 | $42,580 | $185,690 |
| 2020 | $6,345 | $209,805 | $32,727 | $177,078 |
| 2019 | $6,398 | $206,001 | $28,152 | $177,849 |
| 2018 | $1,919 | $197,818 | $28,152 | $169,666 |
| 2017 | $6,263 | $197,818 | $28,152 | $169,666 |
| 2016 | $6,285 | $198,500 | $28,152 | $170,348 |
| 2015 | $2,805 | $195,718 | $28,152 | $167,566 |
| 2014 | $2,805 | $171,379 | $28,152 | $143,227 |
Source: Public Records
Map
Nearby Homes
- 16535 Oat Mill Dr
- 7622 Mccormick Mill Ct
- 7614 Mccormick Mill Ct
- 16319 Chimneystone Dr
- 16510 Wellers Way
- 16315 Battlecreek Dr
- 16514 Innisbrook Dr
- 16606 Stoneside Dr
- 16215 Cairngorm Ave
- 16215 Wemyss Bay Rd
- 7719 Woodlett Ct
- 17010 Poplar Hill St
- 16114 Kintyre Point Rd
- 16335 Drystone Ln
- 8411 Sandestine Ct
- 8322 Castle Pond Ct
- 16502 Rainbow Lake Rd
- 16511 Crystal View Ct
- 16911 Shady Square Ct
- 8410 Castle Pond Ct
- 16514 Wheatmill Ct
- 16506 Wheatmill Ct
- 16518 Wheatmill Ct
- 16523 Oat Mill Dr
- 16527 Oat Mill Dr
- 16519 Oat Mill Dr
- 16531 Oat Mill Dr
- 16515 Wheatmill Ct
- 16502 Wheatmill Ct
- 16522 Wheatmill Ct
- 16519 Wheatmill Ct
- 16511 Wheatmill Ct
- 16503 Wheatmill Ct
- 16515 Oat Mill Dr
- 16523 Wheatmill Ct
- 16507 Wheatmill Ct
- 16526 Wheatmill Ct
- 16511 Oat Mill Dr
- 16527 Wheatmill Ct
- 7630 Mccormick Mill Ct