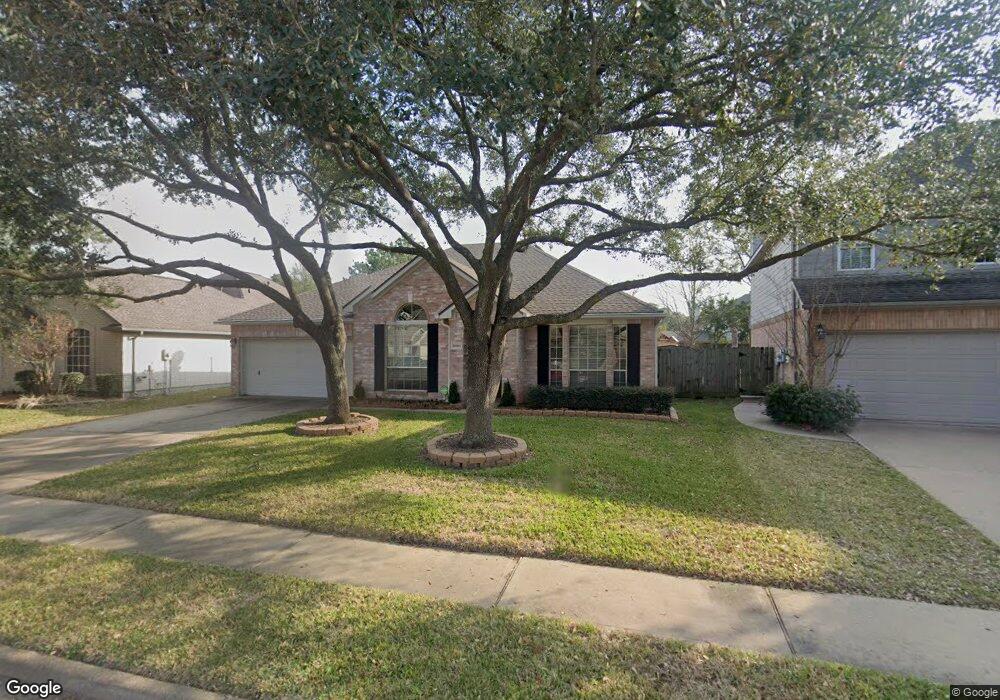
16515 Oat Mill Dr Houston, TX 77095
Copperfield NeighborhoodEstimated Value: $306,361 - $331,000
3
Beds
2
Baths
2,192
Sq Ft
$145/Sq Ft
Est. Value
About This Home
This home is located at 16515 Oat Mill Dr, Houston, TX 77095 and is currently estimated at $316,840, approximately $144 per square foot. 16515 Oat Mill Dr is a home located in Harris County with nearby schools including Lowery Elementary School, Aragon Middle School, and Langham Creek High School.
Ownership History
Date
Name
Owned For
Owner Type
Purchase Details
Closed on
Jun 23, 2008
Sold by
Kuver Samuel C and Kuver Marci L
Bought by
Ferguson David and Fairchild Ferguson Sandra
Current Estimated Value
Home Financials for this Owner
Home Financials are based on the most recent Mortgage that was taken out on this home.
Original Mortgage
$153,392
Outstanding Balance
$98,431
Interest Rate
6.05%
Mortgage Type
FHA
Estimated Equity
$218,409
Purchase Details
Closed on
May 7, 2004
Sold by
Atkins Lesser Denise L and Lesser Vernon Scott
Bought by
Kuver Samuel C and Kuver Marci L
Home Financials for this Owner
Home Financials are based on the most recent Mortgage that was taken out on this home.
Original Mortgage
$138,821
Interest Rate
5.53%
Mortgage Type
FHA
Purchase Details
Closed on
Jun 30, 2000
Sold by
Gateway Homes Inc
Bought by
Atkins Denise L
Home Financials for this Owner
Home Financials are based on the most recent Mortgage that was taken out on this home.
Original Mortgage
$123,200
Interest Rate
8.66%
Create a Home Valuation Report for This Property
The Home Valuation Report is an in-depth analysis detailing your home's value as well as a comparison with similar homes in the area
Home Values in the Area
Average Home Value in this Area
Purchase History
| Date | Buyer | Sale Price | Title Company |
|---|---|---|---|
| Ferguson David | -- | Etc | |
| Kuver Samuel C | -- | Stewart Title Houston Divisi | |
| Atkins Denise L | -- | -- |
Source: Public Records
Mortgage History
| Date | Status | Borrower | Loan Amount |
|---|---|---|---|
| Open | Ferguson David | $153,392 | |
| Previous Owner | Kuver Samuel C | $138,821 | |
| Previous Owner | Atkins Denise L | $123,200 |
Source: Public Records
Tax History Compared to Growth
Tax History
| Year | Tax Paid | Tax Assessment Tax Assessment Total Assessment is a certain percentage of the fair market value that is determined by local assessors to be the total taxable value of land and additions on the property. | Land | Improvement |
|---|---|---|---|---|
| 2025 | $2,080 | $286,967 | $66,639 | $220,328 |
| 2024 | $2,080 | $289,985 | $66,639 | $223,346 |
| 2023 | $2,080 | $291,158 | $66,639 | $224,519 |
| 2022 | $6,393 | $285,286 | $44,305 | $240,981 |
| 2021 | $6,149 | $213,444 | $44,305 | $169,139 |
| 2020 | $6,185 | $204,523 | $34,052 | $170,471 |
| 2019 | $6,137 | $197,598 | $29,292 | $168,306 |
| 2018 | $1,819 | $189,171 | $29,292 | $159,879 |
| 2017 | $5,990 | $189,171 | $29,292 | $159,879 |
| 2016 | $5,783 | $182,632 | $29,292 | $153,340 |
| 2015 | $3,810 | $180,183 | $29,292 | $150,891 |
| 2014 | $3,810 | $159,770 | $29,292 | $130,478 |
Source: Public Records
Map
Nearby Homes
- 7622 Mccormick Mill Ct
- 16535 Oat Mill Dr
- 7614 Mccormick Mill Ct
- 16319 Chimneystone Dr
- 16315 Battlecreek Dr
- 16510 Wellers Way
- 16514 Innisbrook Dr
- 16215 Cairngorm Ave
- 16606 Stoneside Dr
- 16215 Wemyss Bay Rd
- 7719 Woodlett Ct
- 16114 Kintyre Point Rd
- 16335 Drystone Ln
- 16502 Rainbow Lake Rd
- 17010 Poplar Hill St
- 16511 Crystal View Ct
- 16026 Autumn Falls Ln
- 7607 Plumtree Forest Cir
- 8411 Sandestine Ct
- 16030 Royal Garden Dr
- 16519 Oat Mill Dr
- 16511 Oat Mill Dr
- 16523 Oat Mill Dr
- 16502 Wheatmill Ct
- 16507 Oat Mill Dr
- 16506 Wheatmill Ct
- 16514 Oat Mill Dr
- 16518 Oat Mill Dr
- 16527 Oat Mill Dr
- 7715 Ashton Dr
- 7711 Ashton Dr
- 16510 Wheatmill Ct
- 7719 Ashton Dr
- 16522 Oat Mill Dr
- 7707 Ashton Dr
- 16503 Oat Mill Dr
- 16503 Wheatmill Ct
- 16510 Oat Mill Dr
- 7723 Ashton Dr
- 7703 Ashton Dr