Estimated Value: $350,425 - $426,000
--
Bed
--
Bath
1,400
Sq Ft
$280/Sq Ft
Est. Value
About This Home
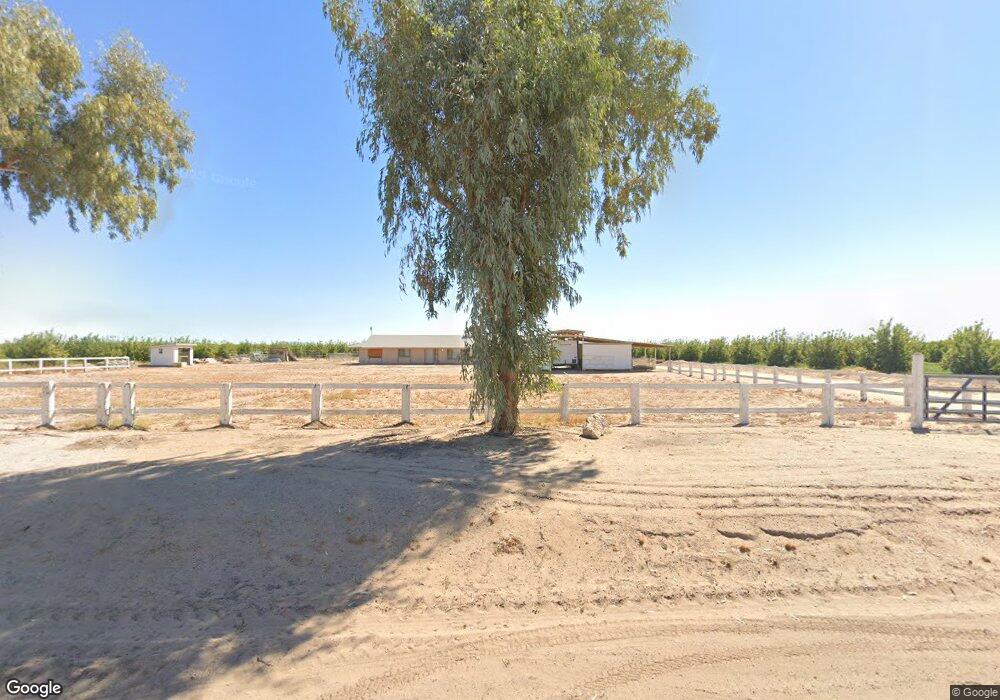
This home is located at 16515 S Avenue 1 E, Yuma, AZ 85365 and is currently estimated at $391,856, approximately $279 per square foot. 16515 S Avenue 1 E is a home located in Yuma County with nearby schools including Palmcroft Elementary School, R. Pete Woodard Junior High School, and Kofa High School.
Ownership History
Date
Name
Owned For
Owner Type
Purchase Details
Closed on
Apr 20, 2015
Sold by
Rowley Jacqueline E and Ross Jacqueline E
Bought by
Romero Jesus
Current Estimated Value
Home Financials for this Owner
Home Financials are based on the most recent Mortgage that was taken out on this home.
Original Mortgage
$204,300
Outstanding Balance
$156,642
Interest Rate
3.63%
Mortgage Type
VA
Estimated Equity
$235,214
Purchase Details
Closed on
Dec 2, 2003
Sold by
Suho Martha A
Bought by
Rowley Jacqueline E
Home Financials for this Owner
Home Financials are based on the most recent Mortgage that was taken out on this home.
Original Mortgage
$78,000
Interest Rate
5.97%
Mortgage Type
New Conventional
Purchase Details
Closed on
Feb 17, 1999
Sold by
Suho Martha A and Foster Martha A
Bought by
Suho Martha A
Home Financials for this Owner
Home Financials are based on the most recent Mortgage that was taken out on this home.
Original Mortgage
$29,000
Interest Rate
6.76%
Create a Home Valuation Report for This Property
The Home Valuation Report is an in-depth analysis detailing your home's value as well as a comparison with similar homes in the area
Home Values in the Area
Average Home Value in this Area
Purchase History
| Date | Buyer | Sale Price | Title Company |
|---|---|---|---|
| Romero Jesus | $200,000 | Chicago Title | |
| Rowley Jacqueline E | $165,000 | First American Title | |
| Suho Martha A | -- | Citizens Title |
Source: Public Records
Mortgage History
| Date | Status | Borrower | Loan Amount |
|---|---|---|---|
| Open | Romero Jesus | $204,300 | |
| Previous Owner | Rowley Jacqueline E | $78,000 | |
| Previous Owner | Suho Martha A | $29,000 |
Source: Public Records
Tax History Compared to Growth
Tax History
| Year | Tax Paid | Tax Assessment Tax Assessment Total Assessment is a certain percentage of the fair market value that is determined by local assessors to be the total taxable value of land and additions on the property. | Land | Improvement |
|---|---|---|---|---|
| 2025 | $1,069 | $13,088 | $3,430 | $9,658 |
| 2024 | $1,057 | $12,464 | $3,438 | $9,026 |
| 2023 | $1,057 | $11,871 | $3,014 | $8,857 |
| 2022 | $1,016 | $11,306 | $2,136 | $9,170 |
| 2021 | $1,095 | $10,767 | $2,199 | $8,568 |
| 2020 | $986 | $10,254 | $2,194 | $8,060 |
| 2019 | $975 | $9,766 | $1,951 | $7,815 |
| 2018 | $931 | $9,302 | $1,217 | $8,085 |
| 2017 | $889 | $9,302 | $1,217 | $8,085 |
| 2016 | $919 | $8,437 | $1,852 | $6,585 |
| 2015 | $787 | $8,035 | $2,539 | $5,496 |
| 2014 | $787 | $7,653 | $2,271 | $5,382 |
Source: Public Records
Map
Nearby Homes
- 000 E County 16th St
- 1693 W County 16 St
- 1851 W County 16th St
- 15583 S Avenue A
- 16850 S Avenue A
- 15487 S Avenue A
- 17618 S Avenue A
- 3620 E County 16 1 4 St
- 15704 S Avenue 2 3 4 E
- 000 S Avenue A 3 4
- 2888 E Verona Dr
- 2870 E Verona Dr
- 2846 E Verona Dr
- 2822 E Verona Dr
- 14585 S 4th Ave
- 14538 S 4th Ave
- 3150 W County 16th St
- 0001 E County 15th St
- 0000 W County 16 1 2 St
- 0000 W County 17 1 2 St
- 16515 S Ave 1 E
- 16367 S Avenue 1 E
- 16367 S Ave 1 E
- 16343 S Avenue 1 E
- 16333 S Avenue 1 E
- 16333 S Ave 1 E
- 16323 S Avenue 1 E
- 16323 S Ave 1 E
- 16311 S Avenue 1 E
- 0 County 16 St Unit 20201061
- 14400 S Avenue 1 E
- 1305 E County 16th St
- 0000 W County 16 St
- 1270 E County 16th St
- 15672 S Avenue 1 E
- 1565 E County 16th St
- 1549 E 72nd St
- 0000 W County 16 1/2 St
- Parcel A E County 16 St
- 1667 E County 16th St