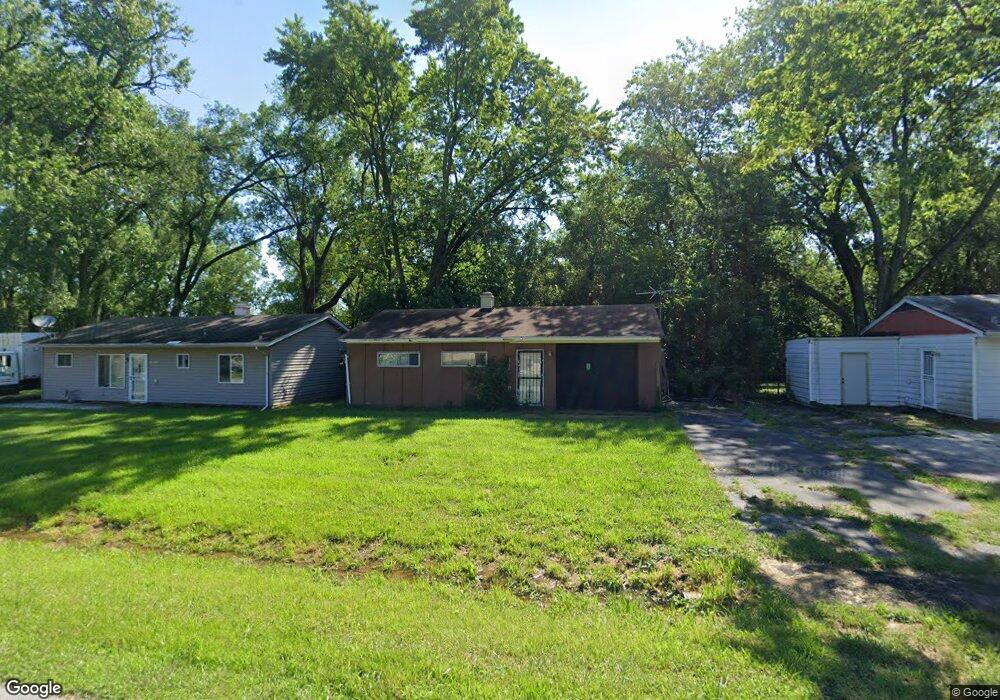
16517 Spaulding Ave Markham, IL 60428
Estimated Value: $138,000 - $150,000
3
Beds
1
Bath
960
Sq Ft
$149/Sq Ft
Est. Value
About This Home
This home is located at 16517 Spaulding Ave, Markham, IL 60428 and is currently estimated at $142,567, approximately $148 per square foot. 16517 Spaulding Ave is a home located in Cook County with nearby schools including Markham Park Elementary School, Prairie-Hills Junior High School, and Hillcrest High School.
Ownership History
Date
Name
Owned For
Owner Type
Purchase Details
Closed on
Apr 4, 2023
Sold by
Yarbrough Karen A
Bought by
City Of Markham
Current Estimated Value
Purchase Details
Closed on
Jul 6, 2012
Sold by
Bowman Ota
Bought by
Johnson Rod
Purchase Details
Closed on
Apr 27, 2012
Sold by
Stonecrest Income & Opportunity Fund I L
Bought by
Bowman Otha
Purchase Details
Closed on
Sep 21, 2011
Sold by
Reo Property Company Lp
Bought by
Stonecrest Income & Opportunity Fund 1 L
Purchase Details
Closed on
Dec 17, 2009
Sold by
Gannon
Bought by
Reo Property Company Lp
Purchase Details
Closed on
Jun 9, 2006
Sold by
Bailey Catherine E
Bought by
Stoneport Builders Inc
Home Financials for this Owner
Home Financials are based on the most recent Mortgage that was taken out on this home.
Original Mortgage
$83,913
Interest Rate
6.72%
Mortgage Type
Unknown
Create a Home Valuation Report for This Property
The Home Valuation Report is an in-depth analysis detailing your home's value as well as a comparison with similar homes in the area
Home Values in the Area
Average Home Value in this Area
Purchase History
| Date | Buyer | Sale Price | Title Company |
|---|---|---|---|
| City Of Markham | -- | None Listed On Document | |
| Johnson Rod | $8,000 | None Available | |
| Bowman Otha | $5,000 | None Available | |
| Stonecrest Income & Opportunity Fund 1 L | $4,000 | None Available | |
| Reo Property Company Lp | -- | None Available | |
| Stoneport Builders Inc | $72,000 | Law Title |
Source: Public Records
Mortgage History
| Date | Status | Borrower | Loan Amount |
|---|---|---|---|
| Previous Owner | Stoneport Builders Inc | $83,913 |
Source: Public Records
Tax History
| Year | Tax Paid | Tax Assessment Tax Assessment Total Assessment is a certain percentage of the fair market value that is determined by local assessors to be the total taxable value of land and additions on the property. | Land | Improvement |
|---|---|---|---|---|
| 2025 | $6,933 | -- | -- | -- |
| 2024 | $6,933 | -- | -- | -- |
| 2023 | $4,445 | $12,001 | $1,796 | $10,205 |
| 2022 | $4,445 | $5,443 | $1,596 | $3,847 |
| 2021 | $4,307 | $5,442 | $1,596 | $3,846 |
| 2020 | $4,208 | $5,442 | $1,596 | $3,846 |
| 2019 | $4,588 | $6,219 | $1,396 | $4,823 |
| 2018 | $4,439 | $6,219 | $1,396 | $4,823 |
| 2017 | $4,201 | $6,219 | $1,396 | $4,823 |
| 2016 | $3,893 | $5,694 | $1,197 | $4,497 |
| 2015 | $3,589 | $5,694 | $1,197 | $4,497 |
| 2014 | $3,596 | $5,694 | $1,197 | $4,497 |
| 2013 | $3,721 | $6,475 | $1,197 | $5,278 |
Source: Public Records
Map
Nearby Homes
- 16524 Sawyer Ave
- 16431 Spaulding Ave
- 16516 Turner Ave
- 16608 Sawyer Ave
- 16632 Sawyer Ave
- 16408 Turner Ave
- 16641 Sawyer Ave
- 16236 Spaulding Ave
- 16325 Saint Louis Ave
- 16302 Trumbull Ave
- 3114 W 163rd St
- 16224 Kedzie Ave
- 16517 Plainview Dr
- 16212 Trumbull Ave
- 3014 W 163rd St
- 16155 Kedzie Pkwy
- 16213 Saint Louis Ave
- 3120 Wilshire Ave
- 16225 Clifton Park Ave
- 16202 Saint Louis Ave
- 16511 Spaulding Ave
- 16529 Spaulding Ave
- 16516 Sawyer Ave
- 16505 Spaulding Ave
- 16510 Sawyer Ave
- 16530 Sawyer Ave
- 16535 Spaulding Ave
- 16524 Spaulding Ave
- 16522 Spaulding Ave
- 16516 Spaulding Ave
- 16536 Sawyer Ave
- 16510 Spaulding Ave
- 16502 Sawyer Ave
- 16502 Sawyer Ave
- 16542 Sawyer Ave
- 16502 Spaulding Ave
- 16547 Spaulding Ave
- 16547 Spaulding Ave
- 16548 Sawyer Ave
- 16511 Turner Ave
Your Personal Tour Guide
Ask me questions while you tour the home.