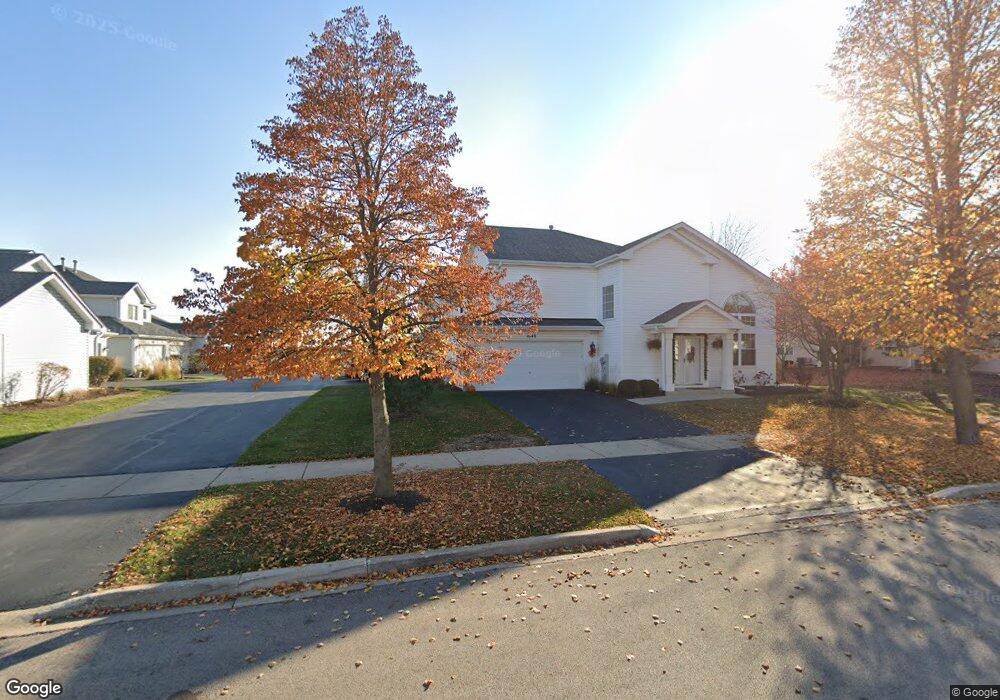
1652 Abington Ln North Aurora, IL 60542
Estimated Value: $273,000 - $294,000
2
Beds
2
Baths
1,623
Sq Ft
$176/Sq Ft
Est. Value
About This Home
This home is located at 1652 Abington Ln, North Aurora, IL 60542 and is currently estimated at $285,202, approximately $175 per square foot. 1652 Abington Ln is a home located in Kane County with nearby schools including Fearn Elementary School, Jewel Middle School, and West Aurora High School.
Ownership History
Date
Name
Owned For
Owner Type
Purchase Details
Closed on
Jul 26, 2017
Sold by
Sanchez Bulmaro Perez
Bought by
Jernstad Matthew N
Current Estimated Value
Home Financials for this Owner
Home Financials are based on the most recent Mortgage that was taken out on this home.
Original Mortgage
$147,184
Outstanding Balance
$122,514
Interest Rate
3.87%
Mortgage Type
FHA
Estimated Equity
$162,688
Purchase Details
Closed on
Aug 29, 2003
Sold by
Jacobs Jon D
Bought by
Sanchez Bulmaro Perez
Home Financials for this Owner
Home Financials are based on the most recent Mortgage that was taken out on this home.
Original Mortgage
$155,460
Interest Rate
5.97%
Mortgage Type
FHA
Purchase Details
Closed on
Jul 31, 1998
Sold by
Waterford Homes Inc
Bought by
Jacobs Jon D
Home Financials for this Owner
Home Financials are based on the most recent Mortgage that was taken out on this home.
Original Mortgage
$110,992
Interest Rate
7.05%
Mortgage Type
FHA
Create a Home Valuation Report for This Property
The Home Valuation Report is an in-depth analysis detailing your home's value as well as a comparison with similar homes in the area
Home Values in the Area
Average Home Value in this Area
Purchase History
| Date | Buyer | Sale Price | Title Company |
|---|---|---|---|
| Jernstad Matthew N | $150,000 | Citywide Title Corp | |
| Sanchez Bulmaro Perez | $158,000 | First American Title | |
| Jacobs Jon D | $117,000 | First American Title Ins Co | |
| Waterford Homes Inc | -- | First American Title Ins Co |
Source: Public Records
Mortgage History
| Date | Status | Borrower | Loan Amount |
|---|---|---|---|
| Open | Jernstad Matthew N | $147,184 | |
| Previous Owner | Sanchez Bulmaro Perez | $155,460 | |
| Previous Owner | Jacobs Jon D | $110,992 |
Source: Public Records
Tax History Compared to Growth
Tax History
| Year | Tax Paid | Tax Assessment Tax Assessment Total Assessment is a certain percentage of the fair market value that is determined by local assessors to be the total taxable value of land and additions on the property. | Land | Improvement |
|---|---|---|---|---|
| 2024 | $5,117 | $74,325 | $10,777 | $63,548 |
| 2023 | $4,873 | $66,409 | $9,629 | $56,780 |
| 2022 | $4,632 | $60,593 | $8,786 | $51,807 |
| 2021 | $4,380 | $56,413 | $8,180 | $48,233 |
| 2020 | $4,768 | $59,873 | $7,598 | $52,275 |
| 2019 | $4,604 | $55,474 | $7,040 | $48,434 |
| 2018 | $4,341 | $51,082 | $6,512 | $44,570 |
| 2017 | $4,150 | $48,031 | $7,381 | $40,650 |
| 2016 | $4,305 | $48,296 | $6,327 | $41,969 |
| 2015 | -- | $42,002 | $5,441 | $36,561 |
| 2014 | -- | $39,094 | $5,233 | $33,861 |
| 2013 | -- | $40,745 | $5,158 | $35,587 |
Source: Public Records
Map
Nearby Homes
- 71 Windstone Dr
- 413 Messenger Cir
- Lot 1 North Orchard Gateway Blvd
- Lot 16 Orchard Gateway Blvd
- 201 Hidden Creek Ln Unit 301
- 311 Hidden Creek Ln Unit 311
- 1202 Fox Hill Ln Unit 362
- 1432 Hartsburg Ln Unit 1
- 420 Hidden Creek Ln Unit 65
- 316 E Victoria Cir Unit 125
- Lot 16 West Orchard Gateway Blvd
- 109 E Victoria Cir Unit 7/5
- 203 E Victoria Cir Unit 9/2
- Lot 6 Towne Center Dr
- Lot 1 South Towne Center Dr
- Lot 13 Towne Center Dr
- Lot 5 Towne Center Dr
- 512 Bennett Dr
- 867 Fair Meadow Ct
- 868 Fair Meadow Ct
- 1656 Abington Ln
- 1648 Abington Ln
- 1660 Abington Ln
- 1636 Abington Ln
- 1640 Abington Ln
- 1632 Abington Ln
- 1672 Abington Ln
- 1672 Abington Ln Unit 1672
- 1644 Abington Ln
- 1668 Abington Ln
- 1664 Abington Ln
- 1676 Abington Ln
- 1641 Abington Ln
- 1633 Abington Ln
- 200 Kathryn Ln
- 1684 Abington Ln
- 1620 Abington Ln
- 1680 Abington Ln
- 1624 Abington Ln
- 1688 Abington Ln