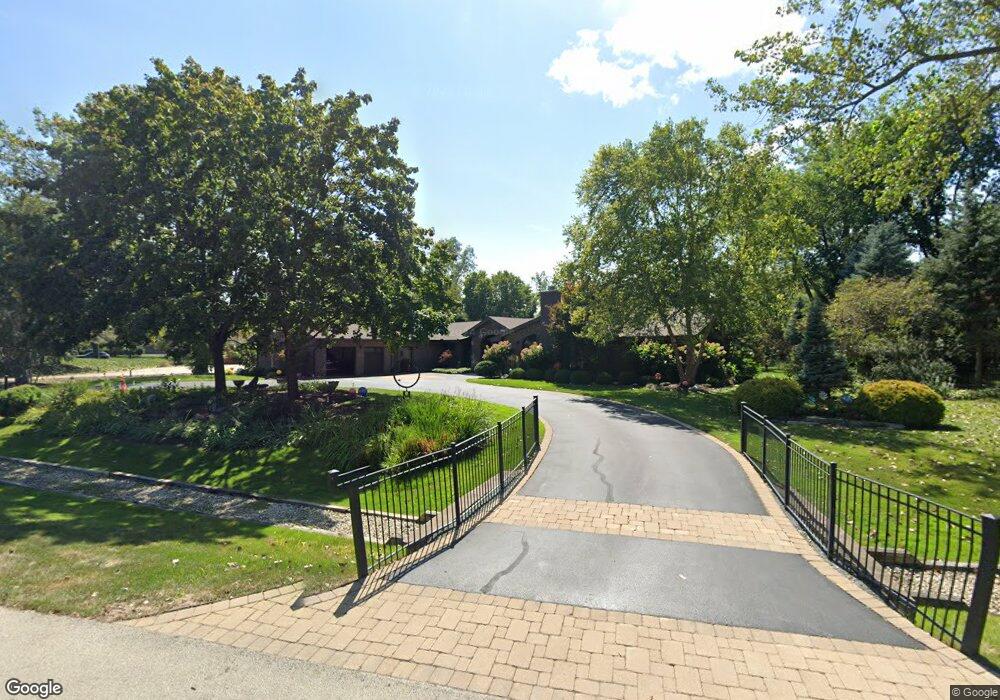
1652 E Course Dr Unit E Riverwoods, IL 60015
Riverwoods Country Club Estates NeighborhoodEstimated Value: $1,004,769 - $1,142,000
4
Beds
3
Baths
3,944
Sq Ft
$276/Sq Ft
Est. Value
About This Home
This home is located at 1652 E Course Dr Unit E, Riverwoods, IL 60015 and is currently estimated at $1,088,692, approximately $276 per square foot. 1652 E Course Dr Unit E is a home located in Lake County with nearby schools including Wilmot Elementary School, Charles J Caruso Middle School, and Deerfield High School.
Ownership History
Date
Name
Owned For
Owner Type
Purchase Details
Closed on
Aug 13, 2011
Sold by
Rosin Allen S
Bought by
Bernfield Jeffrey B and Bernfield Gwen R
Current Estimated Value
Purchase Details
Closed on
Aug 12, 2011
Sold by
Rosin Allen S and Rosin Mary Ellen
Bought by
Rosin Allen S
Purchase Details
Closed on
Nov 1, 2004
Sold by
Gitelman Michael
Bought by
Rosin Mary Ellen and The Mary Ellen Rusin Trust
Home Financials for this Owner
Home Financials are based on the most recent Mortgage that was taken out on this home.
Original Mortgage
$543,750
Interest Rate
5.25%
Mortgage Type
Unknown
Purchase Details
Closed on
Oct 14, 2003
Sold by
Gitelman Michael B
Bought by
Gitelman Michael and Michael Gitelman Revocable Trust
Create a Home Valuation Report for This Property
The Home Valuation Report is an in-depth analysis detailing your home's value as well as a comparison with similar homes in the area
Home Values in the Area
Average Home Value in this Area
Purchase History
| Date | Buyer | Sale Price | Title Company |
|---|---|---|---|
| Bernfield Jeffrey B | $102,000 | Multiple | |
| Rosin Allen S | -- | Multiple | |
| Rosin Mary Ellen | $725,000 | Chicago Title Insurance Comp | |
| Gitelman Michael | -- | -- |
Source: Public Records
Mortgage History
| Date | Status | Borrower | Loan Amount |
|---|---|---|---|
| Previous Owner | Rosin Mary Ellen | $543,750 |
Source: Public Records
Tax History
| Year | Tax Paid | Tax Assessment Tax Assessment Total Assessment is a certain percentage of the fair market value that is determined by local assessors to be the total taxable value of land and additions on the property. | Land | Improvement |
|---|---|---|---|---|
| 2024 | $20,789 | $252,039 | $93,558 | $158,481 |
| 2023 | $23,105 | $241,880 | $89,787 | $152,093 |
| 2022 | $23,105 | $253,579 | $94,010 | $159,569 |
| 2021 | $21,751 | $244,484 | $90,638 | $153,846 |
| 2020 | $20,903 | $244,999 | $90,829 | $154,170 |
| 2019 | $20,111 | $244,583 | $90,675 | $153,908 |
| 2018 | $9,765 | $231,513 | $96,109 | $135,404 |
| 2017 | $18,261 | $230,774 | $95,802 | $134,972 |
| 2016 | $17,765 | $222,047 | $92,179 | $129,868 |
| 2015 | $16,329 | $208,632 | $86,610 | $122,022 |
| 2014 | $15,725 | $195,394 | $87,229 | $108,165 |
| 2012 | $15,365 | $193,671 | $86,460 | $107,211 |
Source: Public Records
Map
Nearby Homes
- 1690 Landy Ln
- 1285 Montgomery Dr
- 1335 Wilmot Rd
- 2655 Crestwood Ln
- 851 Sutton Ct
- 11 Wellington Ct
- 1890 Robinwood Ln
- 930 King Richards Ct
- 1525 Hawthorne Place
- 1632 Village Green Ct
- 1800 Telegraph Rd
- 1478 Shawnee Trail
- 1005 Hiawatha Ln
- 2640 Forest Glen Trail
- 1380 Valley Rd
- 1054 Broadmoor Place
- 1004 Broadmoor Place
- 3031 Farner Ct
- 1420 Crowe Ave
- 1165 Linden Ave
- 1674 E Course Dr Unit E
- 1638 E Course Dr Unit E
- 1663 E Course Dr Unit E
- 1641 E Course Dr Unit E
- 1606 E Course Dr Unit E
- 1675 E Course Dr Unit E
- 1629 E Course Dr Unit E
- 1687 E Course Dr Unit E
- 1574 E Course Dr Unit E
- 1683 E Course Dr
- 1607 E Course Dr Unit E
- 1633 Saunders Rd
- 1661 Saunders Rd
- 1605 Saunders Rd
- 1583 E Course Dr Unit E
- 1683 Saunders Rd
- 1709 E Course Dr Unit E
- 1552 E Course Dr Unit E
- 1561 E Course Dr Unit E
- 1705 Saunders Rd
Your Personal Tour Guide
Ask me questions while you tour the home.