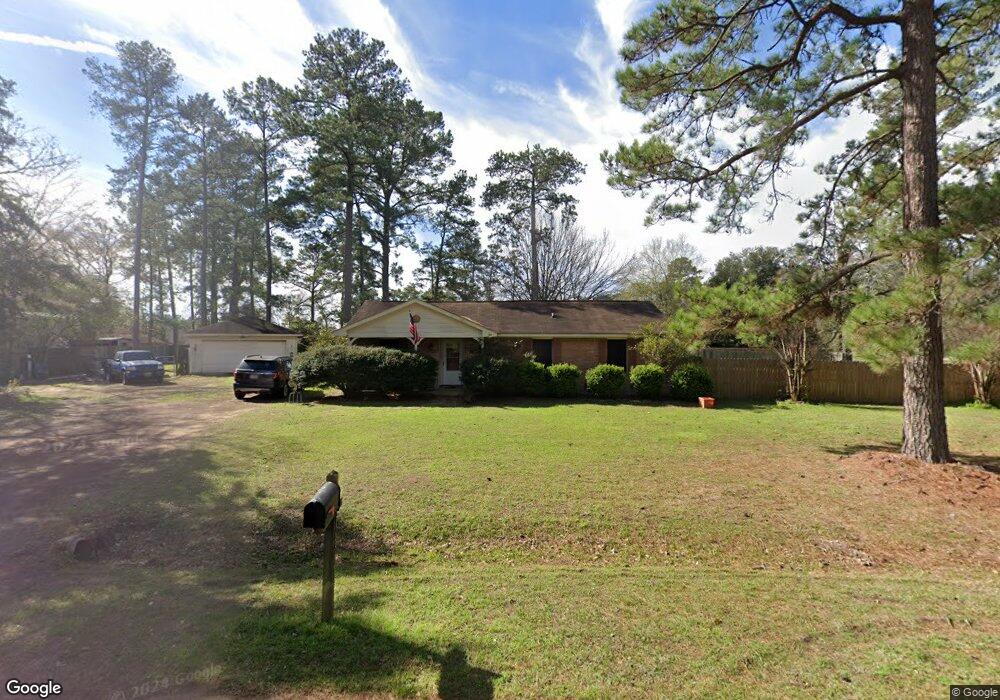
16523 Mockingbird Ln Magnolia, TX 77355
Estimated Value: $284,237 - $402,000
--
Bed
2
Baths
1,388
Sq Ft
$232/Sq Ft
Est. Value
About This Home
This home is located at 16523 Mockingbird Ln, Magnolia, TX 77355 and is currently estimated at $322,309, approximately $232 per square foot. 16523 Mockingbird Ln is a home located in Montgomery County with nearby schools including J.L. Lyon Elementary School, Magnolia Sixth Grade Campus, and Magnolia Junior High School.
Ownership History
Date
Name
Owned For
Owner Type
Purchase Details
Closed on
Sep 3, 2010
Sold by
Ciecierski Michelle L
Bought by
Horacek Mark S
Current Estimated Value
Purchase Details
Closed on
May 9, 2008
Sold by
Wheaton Dixie Roxanne and Wheaton Dixie R
Bought by
Horacek Mark S and Ciecierski Michelle L
Home Financials for this Owner
Home Financials are based on the most recent Mortgage that was taken out on this home.
Original Mortgage
$120,000
Interest Rate
5.86%
Mortgage Type
Purchase Money Mortgage
Purchase Details
Closed on
Oct 20, 2005
Sold by
Wheaton Paul Arthur and Wheaton Paul A
Bought by
Wheaton Dixie Roxanne and Wheaton Dixie R
Purchase Details
Closed on
May 7, 1997
Sold by
Stanley Construction Company
Bought by
Wheaton Paul A and Wheaton Dixie R
Home Financials for this Owner
Home Financials are based on the most recent Mortgage that was taken out on this home.
Original Mortgage
$64,000
Interest Rate
8.16%
Create a Home Valuation Report for This Property
The Home Valuation Report is an in-depth analysis detailing your home's value as well as a comparison with similar homes in the area
Home Values in the Area
Average Home Value in this Area
Purchase History
| Date | Buyer | Sale Price | Title Company |
|---|---|---|---|
| Horacek Mark S | -- | None Available | |
| Horacek Mark S | -- | Stewart Title Houston Div | |
| Wheaton Dixie Roxanne | -- | None Available | |
| Wheaton Paul A | -- | -- |
Source: Public Records
Mortgage History
| Date | Status | Borrower | Loan Amount |
|---|---|---|---|
| Previous Owner | Horacek Mark S | $120,000 | |
| Previous Owner | Wheaton Paul A | $64,000 | |
| Closed | Wheaton Dixie Roxanne | $0 |
Source: Public Records
Tax History Compared to Growth
Tax History
| Year | Tax Paid | Tax Assessment Tax Assessment Total Assessment is a certain percentage of the fair market value that is determined by local assessors to be the total taxable value of land and additions on the property. | Land | Improvement |
|---|---|---|---|---|
| 2025 | $1,851 | $207,648 | -- | -- |
| 2024 | $1,587 | $188,771 | -- | -- |
| 2023 | $1,587 | $171,610 | $55,760 | $180,830 |
| 2022 | $2,753 | $156,010 | $62,450 | $163,730 |
| 2021 | $2,636 | $141,830 | $22,300 | $123,730 |
| 2020 | $2,609 | $128,940 | $22,300 | $106,640 |
| 2019 | $2,451 | $121,680 | $22,300 | $106,430 |
| 2018 | $1,872 | $110,620 | $6,970 | $103,650 |
| 2017 | $2,346 | $110,620 | $6,970 | $103,650 |
| 2016 | $2,239 | $105,570 | $6,970 | $112,340 |
| 2015 | $1,759 | $95,970 | $6,970 | $89,000 |
| 2014 | $1,759 | $91,960 | $6,970 | $84,990 |
Source: Public Records
Map
Nearby Homes
- 16526 Walnut Springs Ln
- 0 Frances
- 16219 Walnut Springs Ln
- 32602 Walnut Creek Rd
- 19007 Turtle Creek Way
- 16218 Evergreen Timbers
- 31512 Walnut Creek Rd
- 00000 Butera Rd
- 16115 Antelope Ln
- 16910 Butera Rd
- 15901 Butera Rd
- 31310 Debbi Ln
- 26718 Stagecoach Crossing Dr
- 31218 Wide Oak Cir
- 26530 S Dogwood Ln
- 16519 Lonesome Pine St
- 15629 Knotty Oaks Trail
- 26523 S Carrol Ln
- 30906 Walnut Creek Rd
- 17447 Country Skies
- 16526 Burklin Ln
- 16515 Mockingbird Ln
- 16522 Burklin Ln
- 16514 Mockingbird Ln
- 16514 Burklin Ln
- 16150 Burklin Ln
- 15502 Long Neck Dr
- 16507 Mockingbird Ln
- 16506 Mockingbird Ln
- 16523 Burklin Ln
- 16506 Burklin Ln
- 16511 Burklin Ln
- 16502 Burklin Ln
- 16518 Walnut Springs Ln
- 16514 Walnut Springs Ln
- 16510 Walnut Springs Ln
- 16507 Burklin Ln
- 31907 Walnut Creek Rd
- 31915 Walnut Creek Rd
- 15615 Long Neck Dr