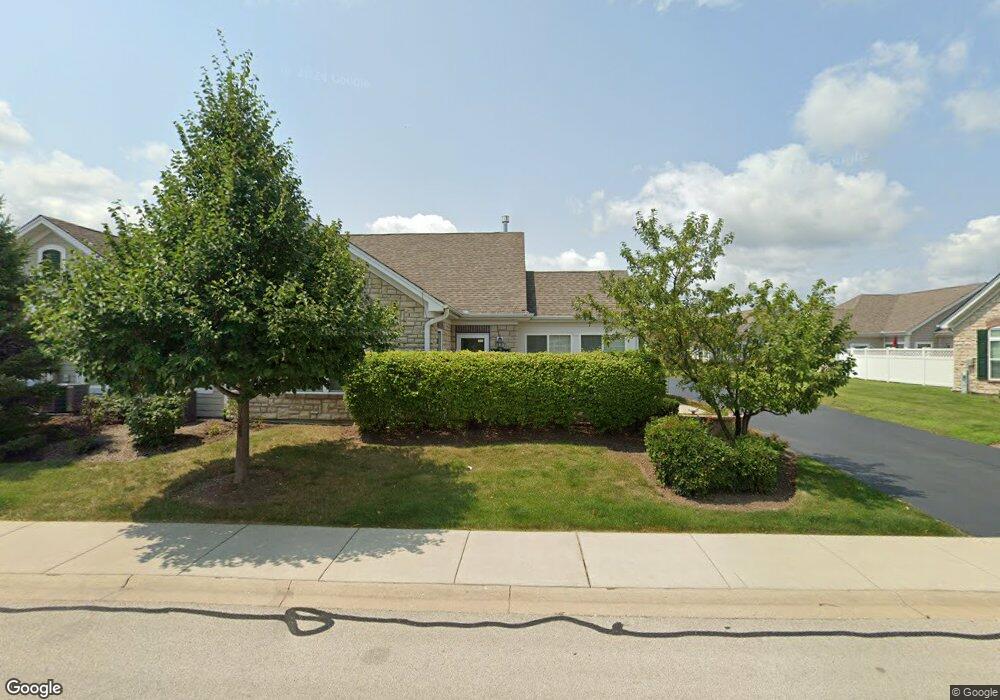
16526 S Fox Run Cir Unit 11B Plainfield, IL 60586
East Plainfield NeighborhoodEstimated Value: $346,618 - $368,000
2
Beds
2
Baths
1,714
Sq Ft
$209/Sq Ft
Est. Value
About This Home
This home is located at 16526 S Fox Run Cir Unit 11B, Plainfield, IL 60586 and is currently estimated at $357,655, approximately $208 per square foot. 16526 S Fox Run Cir Unit 11B is a home located in Will County with nearby schools including River View Elementary School, Timber Ridge Middle School, and Plainfield Central High School.
Ownership History
Date
Name
Owned For
Owner Type
Purchase Details
Closed on
Jul 8, 2022
Sold by
Walsh James
Bought by
Todd Michael Moore And Laurie Peyla Rambo Tru
Current Estimated Value
Purchase Details
Closed on
Feb 7, 2020
Sold by
Copperstein Marvin and Copperstein Valerie K
Bought by
Passas Margaret M
Purchase Details
Closed on
Oct 6, 2014
Sold by
Copperstein Marvin and Copperstein Valerie K
Bought by
Copperstein Marvin and Copperstein Valerie K
Purchase Details
Closed on
Apr 21, 2014
Sold by
Villas At Fox Run Llc
Bought by
Copperstein Marvin and Copperstein Valerie K
Home Financials for this Owner
Home Financials are based on the most recent Mortgage that was taken out on this home.
Original Mortgage
$220,655
Interest Rate
4%
Mortgage Type
VA
Create a Home Valuation Report for This Property
The Home Valuation Report is an in-depth analysis detailing your home's value as well as a comparison with similar homes in the area
Home Values in the Area
Average Home Value in this Area
Purchase History
| Date | Buyer | Sale Price | Title Company |
|---|---|---|---|
| Todd Michael Moore And Laurie Peyla Rambo Tru | $309,000 | Troy Steven Plato | |
| Passas Margaret M | $262,500 | Greater Illinois Title Co | |
| Copperstein Marvin | -- | Chicago Title Insurance Co | |
| Copperstein Marvin | $216,011 | First American Title |
Source: Public Records
Mortgage History
| Date | Status | Borrower | Loan Amount |
|---|---|---|---|
| Previous Owner | Copperstein Marvin | $220,655 |
Source: Public Records
Tax History Compared to Growth
Tax History
| Year | Tax Paid | Tax Assessment Tax Assessment Total Assessment is a certain percentage of the fair market value that is determined by local assessors to be the total taxable value of land and additions on the property. | Land | Improvement |
|---|---|---|---|---|
| 2024 | $7,262 | $106,506 | $9,158 | $97,348 |
| 2023 | $7,262 | $96,194 | $8,271 | $87,923 |
| 2022 | $7,227 | $95,034 | $8,171 | $86,863 |
| 2021 | $6,818 | $88,816 | $7,636 | $81,180 |
| 2020 | $6,299 | $86,296 | $7,419 | $78,877 |
| 2019 | $6,050 | $82,226 | $7,069 | $75,157 |
| 2018 | $5,743 | $77,256 | $6,642 | $70,614 |
| 2017 | $5,535 | $73,416 | $6,312 | $67,104 |
| 2016 | $5,667 | $73,302 | $6,020 | $67,282 |
| 2015 | -- | $68,667 | $5,639 | $63,028 |
Source: Public Records
Map
Nearby Homes
- 23736 Dayfield Ct
- 23901 Cahills Way
- 23911 Mc Mullin Cir Unit 622
- 00000 Dayfield Dr
- 0000 Dayfield Dr
- 000000 Dayfield Dr
- 0 Dayfield Dr Unit MRD11616300
- 16062 S Lexington Dr
- 23545 W Rueben St
- 0007 Illinois Route 59
- 0003 Illinois Route 59
- 0009 Illinois Route 59
- 0005 Illinois Route 59
- 0006 Illinois Route 59
- 16040 S Arbor Dr
- 23538 W Rueben St Unit 6
- 23314 W Leach Dr
- 16320 Spring Creek Ln
- 23213 W Kennebec Dr
- 2731 Old Woods Trail Unit 9C
- 16526 S Fox Run Cir
- 16530 S Fox Run Cir
- Lot 123 S Fox Run Cir
- Lot 124 S Fox Run Cir
- Lot 122 S Fox Run Cir
- 1117 S Fox Run Cir
- 1115 S Fox Run Cir
- Lot 125 S Fox Run Cir
- Lot 121 S Fox Run Cir
- 1113 S Fox Run Cir
- 1111 S Fox Run Cir
- 1114 S Fox Run Cir
- 1112 S Fox Run Cir
- 1116 S Fox Run Cir
- 16532 S Fox Run Cir Unit 11D
- 16532 S Fox Run Cir
- 16528 S Fox Run Cir Unit 11C
- 16528 S Fox Run Cir
- 16520 S Fox Run Cir
- 16520 S Fox Run Cir Unit 17D