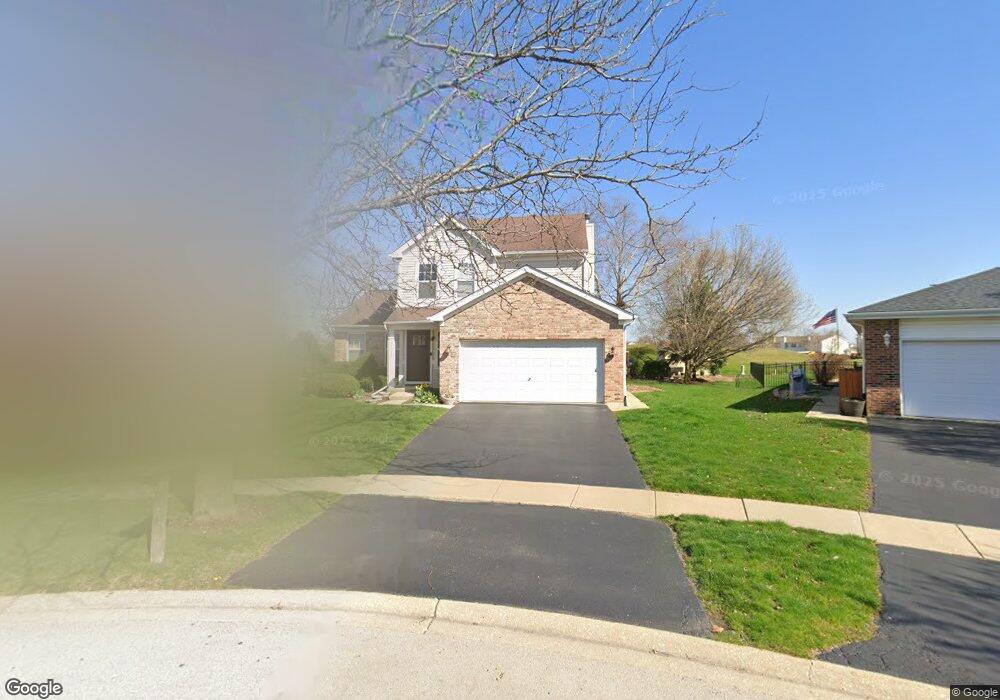
16528 W Apache Dr Lockport, IL 60441
Estimated Value: $409,893 - $432,000
4
Beds
3
Baths
1,960
Sq Ft
$214/Sq Ft
Est. Value
About This Home
This home is located at 16528 W Apache Dr, Lockport, IL 60441 and is currently estimated at $418,973, approximately $213 per square foot. 16528 W Apache Dr is a home located in Will County with nearby schools including William J. Butler, Hadley Middle School, and Homer Jr High School.
Ownership History
Date
Name
Owned For
Owner Type
Purchase Details
Closed on
Aug 3, 2007
Sold by
Johnson Timothy J and Johnson Ruby A
Bought by
Pollos Nicholas and Pollos Michelle
Current Estimated Value
Home Financials for this Owner
Home Financials are based on the most recent Mortgage that was taken out on this home.
Original Mortgage
$221,600
Outstanding Balance
$166,410
Interest Rate
10.75%
Mortgage Type
Purchase Money Mortgage
Estimated Equity
$252,563
Purchase Details
Closed on
Aug 7, 2001
Sold by
Centex Homes
Bought by
Johnson Timothy J and Johnson Ruby A
Home Financials for this Owner
Home Financials are based on the most recent Mortgage that was taken out on this home.
Original Mortgage
$162,000
Interest Rate
7.03%
Create a Home Valuation Report for This Property
The Home Valuation Report is an in-depth analysis detailing your home's value as well as a comparison with similar homes in the area
Home Values in the Area
Average Home Value in this Area
Purchase History
| Date | Buyer | Sale Price | Title Company |
|---|---|---|---|
| Pollos Nicholas | $277,000 | Citywide Title Corp | |
| Johnson Timothy J | $224,000 | Chicago Title Insurance Co |
Source: Public Records
Mortgage History
| Date | Status | Borrower | Loan Amount |
|---|---|---|---|
| Open | Pollos Nicholas | $221,600 | |
| Previous Owner | Johnson Timothy J | $162,000 |
Source: Public Records
Tax History
| Year | Tax Paid | Tax Assessment Tax Assessment Total Assessment is a certain percentage of the fair market value that is determined by local assessors to be the total taxable value of land and additions on the property. | Land | Improvement |
|---|---|---|---|---|
| 2024 | $9,992 | $122,095 | $25,999 | $96,096 |
| 2023 | $9,992 | $110,674 | $23,567 | $87,107 |
| 2022 | $10,300 | $115,467 | $20,375 | $95,092 |
| 2021 | $9,836 | $109,396 | $19,304 | $90,092 |
| 2020 | $9,799 | $105,371 | $18,594 | $86,777 |
| 2019 | $9,430 | $101,367 | $17,887 | $83,480 |
| 2018 | $9,224 | $97,801 | $17,682 | $80,119 |
| 2017 | $9,082 | $95,063 | $17,187 | $77,876 |
| 2016 | $8,884 | $91,893 | $16,614 | $75,279 |
| 2015 | $8,662 | $88,443 | $15,990 | $72,453 |
| 2014 | $8,662 | $86,616 | $15,660 | $70,956 |
| 2013 | $8,662 | $86,616 | $15,660 | $70,956 |
Source: Public Records
Map
Nearby Homes
- 14847 S Hillside Dr
- 14845 S Hillside Dr
- 14805 S Hillside Dr
- 14801 S Hillside Dr
- 17259 Long Bow Dr
- 16510 Teton Dr
- 16641 W Oneida Dr
- 16704 W Natoma Dr
- 15880 W Bruce Rd
- 17040 Cheyenne Ct
- 16738 W Natoma Dr
- 17656 S Gilbert Dr
- 17543 S Gilbert Dr
- 17053 Mendota Dr
- 17213 Mendota Dr
- 17009 Mendota Dr
- 16830 S Parker Ridge Dr
- 17113 Manitoba
- 15911 Crimson Dr
- 17030 Roosevelt Ave
- 16532 W Apache Dr
- 16524 W Apache Dr
- 16536 W Apache Dr
- 16516 W Apache Dr
- 16540 W Apache Dr
- 16533 W Apache Dr
- 16515 W Apache Dr
- 16544 W Apache Dr
- 16447 W Oneida Dr
- 16500 W Delaware Dr
- 16509 W Apache Dr
- 16548 W Apache Dr
- 16506 W Delaware Dr
- 16545 W Apache Dr
- 16451 W Oneida Dr
- 16506 W Montauk Dr
- 16512 W Montauk Dr
- 16512 W Delaware Dr
Your Personal Tour Guide
Ask me questions while you tour the home.