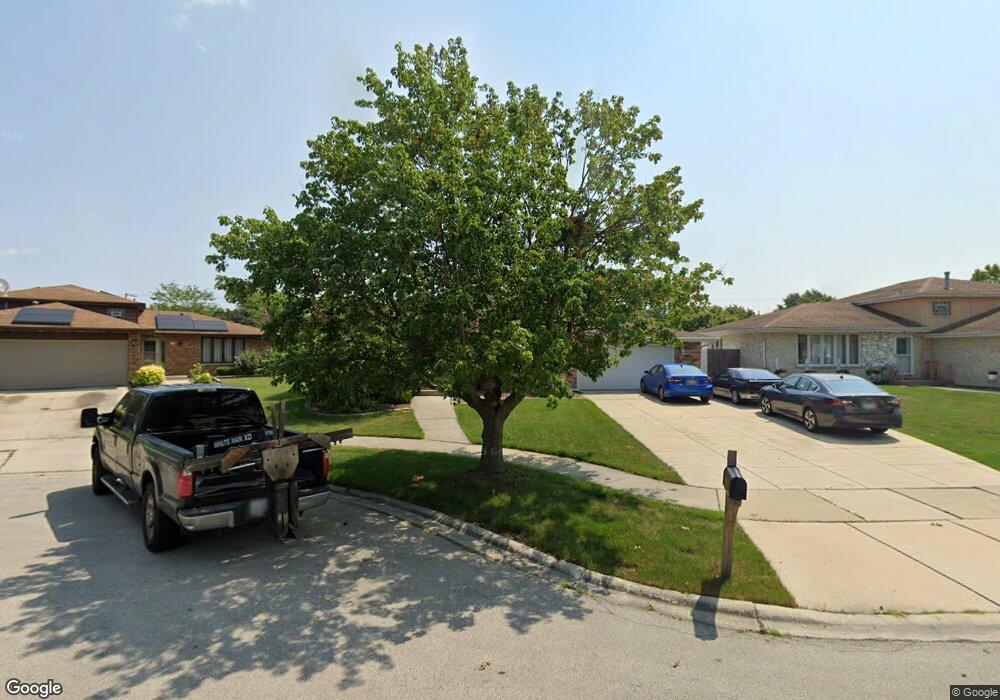
16537 Clover Ln Tinley Park, IL 60487
East Fernway Park NeighborhoodEstimated Value: $360,000 - $404,000
3
Beds
3
Baths
1,196
Sq Ft
$315/Sq Ft
Est. Value
About This Home
This home is located at 16537 Clover Ln, Tinley Park, IL 60487 and is currently estimated at $376,353, approximately $314 per square foot. 16537 Clover Ln is a home located in Cook County with nearby schools including Christa Mcauliffe School, Virgil I Grissom Middle School, and Victor J Andrew High School.
Ownership History
Date
Name
Owned For
Owner Type
Purchase Details
Closed on
Jul 14, 2006
Sold by
Silkowski Douglas S and Silkowski Susan M
Bought by
Kmiec Kevin and Kmiec Yvonne
Current Estimated Value
Home Financials for this Owner
Home Financials are based on the most recent Mortgage that was taken out on this home.
Original Mortgage
$210,000
Outstanding Balance
$125,222
Interest Rate
6.73%
Mortgage Type
Unknown
Estimated Equity
$251,131
Purchase Details
Closed on
Jul 1, 1999
Sold by
Silkowski Douglas S
Bought by
Silkowski Douglas S and Warn Susan M
Home Financials for this Owner
Home Financials are based on the most recent Mortgage that was taken out on this home.
Original Mortgage
$161,500
Interest Rate
6.92%
Purchase Details
Closed on
May 19, 1999
Sold by
Urbaniak Leonard J and Urbaniak Sharon
Bought by
Silkowski Douglas S
Home Financials for this Owner
Home Financials are based on the most recent Mortgage that was taken out on this home.
Original Mortgage
$161,500
Interest Rate
6.92%
Create a Home Valuation Report for This Property
The Home Valuation Report is an in-depth analysis detailing your home's value as well as a comparison with similar homes in the area
Home Values in the Area
Average Home Value in this Area
Purchase History
| Date | Buyer | Sale Price | Title Company |
|---|---|---|---|
| Kmiec Kevin | $284,500 | Chicago Title Insurance Co | |
| Silkowski Douglas S | -- | Chicago Title Insurance Co | |
| Silkowski Douglas S | $170,000 | -- |
Source: Public Records
Mortgage History
| Date | Status | Borrower | Loan Amount |
|---|---|---|---|
| Open | Kmiec Kevin | $210,000 | |
| Previous Owner | Silkowski Douglas S | $161,500 |
Source: Public Records
Tax History Compared to Growth
Tax History
| Year | Tax Paid | Tax Assessment Tax Assessment Total Assessment is a certain percentage of the fair market value that is determined by local assessors to be the total taxable value of land and additions on the property. | Land | Improvement |
|---|---|---|---|---|
| 2024 | $7,409 | $30,000 | $5,021 | $24,979 |
| 2023 | $5,334 | $30,000 | $5,021 | $24,979 |
| 2022 | $5,334 | $18,385 | $3,863 | $14,522 |
| 2021 | $5,194 | $18,383 | $3,862 | $14,521 |
| 2020 | $5,135 | $18,383 | $3,862 | $14,521 |
| 2019 | $5,174 | $19,383 | $3,476 | $15,907 |
| 2018 | $5,318 | $20,190 | $3,476 | $16,714 |
| 2017 | $5,194 | $20,190 | $3,476 | $16,714 |
| 2016 | $4,388 | $15,708 | $3,090 | $12,618 |
| 2015 | $5,047 | $17,984 | $3,090 | $14,894 |
| 2014 | $5,022 | $17,984 | $3,090 | $14,894 |
| 2013 | $4,723 | $18,267 | $3,090 | $15,177 |
Source: Public Records
Map
Nearby Homes
- 16401 Tanbark Dr
- 8400 167th St
- 16439 Cherry Hill Ave
- 8440 163rd St
- 8564 Cherry Stone Place
- 8319 161st Place
- 8135 Bormet Dr
- 8249 161st Place
- 8118 Tudor Ln
- 8316 161st Place Unit 1270
- 16413 Prairie Dr
- 16122 Pine Dr Unit 2476
- 8136 168th Place Unit 3E
- 16107 Eagle Ridge Dr Unit 3N
- 8710 W 168th St
- 8106 168th Place Unit 3W
- 16114 Bormet Dr
- 16933 Richards Dr
- 8118 168th Place
- 7914 164th Ct Unit 262
- 16543 Clover Ln
- 16531 Clover Ln
- 16549 Clover Ln
- 8408 165th Place
- 8421 165th Place
- 16555 Clover Ln
- 8416 165th Place
- 16529 84th Ave
- 16512 84th Ave
- 16523 84th Ave
- 16550 Clover Ln
- 8424 165th Place
- 8340 Tanbark Dr
- 16561 Clover Ln
- 8429 165th Place
- 16517 84th Ave
- 16558 Clover Ln Unit 3
- 8432 165th Place
- 16567 Clover Ln
- 16511 84th Ave