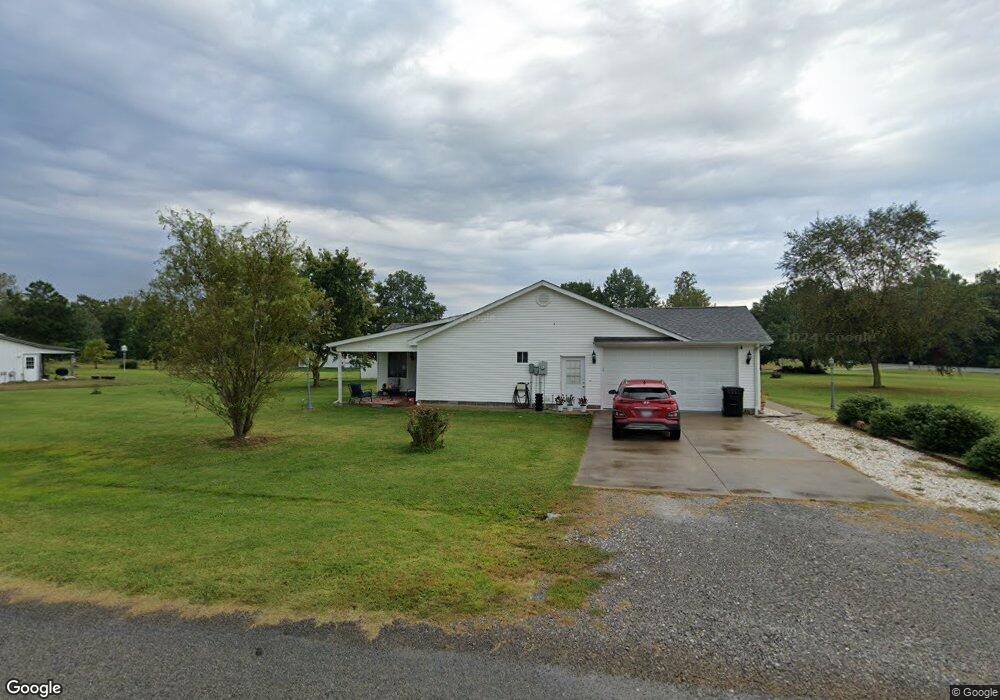
16537 Heatherbrook Ln Marion, IL 62959
Estimated Value: $247,000 - $323,000
Studio
--
Bath
1,881
Sq Ft
$153/Sq Ft
Est. Value
About This Home
This home is located at 16537 Heatherbrook Ln, Marion, IL 62959 and is currently estimated at $287,062, approximately $152 per square foot. 16537 Heatherbrook Ln is a home located in Williamson County with nearby schools including Washington Elementary School, Marion Junior High School, and Marion High School.
Ownership History
Date
Name
Owned For
Owner Type
Purchase Details
Closed on
Oct 15, 2024
Sold by
Fowler Thomas Lawson and Fowler Shelby
Bought by
Wadas Joseph Brandon and Wadas Angelina Raye
Current Estimated Value
Home Financials for this Owner
Home Financials are based on the most recent Mortgage that was taken out on this home.
Original Mortgage
$170,000
Outstanding Balance
$168,091
Interest Rate
6%
Mortgage Type
New Conventional
Estimated Equity
$118,971
Purchase Details
Closed on
Aug 2, 2021
Sold by
Dorris-Labotte Barbara K
Bought by
Fowler Thomas Lawson
Home Financials for this Owner
Home Financials are based on the most recent Mortgage that was taken out on this home.
Original Mortgage
$165,000
Interest Rate
2.93%
Mortgage Type
New Conventional
Create a Home Valuation Report for This Property
The Home Valuation Report is an in-depth analysis detailing your home's value as well as a comparison with similar homes in the area
Purchase History
| Date | Buyer | Sale Price | Title Company |
|---|---|---|---|
| Wadas Joseph Brandon | $270,000 | None Listed On Document | |
| Wadas Joseph Brandon | $270,000 | None Listed On Document | |
| Fowler Thomas Lawson | $225,000 | Law Offices Of Kacey Eisenhaue |
Source: Public Records
Mortgage History
| Date | Status | Borrower | Loan Amount |
|---|---|---|---|
| Open | Wadas Joseph Brandon | $170,000 | |
| Closed | Wadas Joseph Brandon | $170,000 | |
| Previous Owner | Fowler Thomas Lawson | $165,000 |
Source: Public Records
Tax History
| Year | Tax Paid | Tax Assessment Tax Assessment Total Assessment is a certain percentage of the fair market value that is determined by local assessors to be the total taxable value of land and additions on the property. | Land | Improvement |
|---|---|---|---|---|
| 2025 | $5,954 | $80,770 | $9,530 | $71,240 |
| 2024 | $5,954 | $80,770 | $9,530 | $71,240 |
| 2023 | $5,954 | $80,770 | $9,530 | $71,240 |
| 2022 | $4,300 | $71,170 | $8,400 | $62,770 |
| 2021 | $3,858 | $68,600 | $8,100 | $60,500 |
| 2020 | $3,858 | $64,810 | $7,650 | $57,160 |
| 2019 | $3,908 | $64,810 | $7,650 | $57,160 |
| 2018 | $3,908 | $64,810 | $7,650 | $57,160 |
| 2017 | $3,833 | $64,810 | $7,650 | $57,160 |
| 2015 | $3,661 | $61,390 | $7,250 | $54,140 |
| 2013 | $2,502 | $61,390 | $7,250 | $54,140 |
| 2012 | $2,502 | $54,090 | $7,250 | $46,840 |
Source: Public Records
Map
Nearby Homes
- 15290 Pittsburg Rd
- 11339 Plumville Rd
- 1234 Khoury League Rd
- 208 W Pennsylvania Ave
- 18655 Pittsburg Rd
- 15866 Moellers Rd
- 1901 Spring Garden Rd
- 1818 Calico Rd
- 012 Perry Rd
- 1812 Calico Rd
- 000 Moellers Rd
- Lot 1 Norman Rd
- Tbd Tbd
- Lot 4 Norman Rd
- 1707 Quail Run
- 1408 Longstreet St
- 12002 Route 166
- 108 Chase Ln
- 205 Dinah Ln
- 0000 Adams Dr
- 16537 Heatherbrook Ln
- 14540 Pittsburg Rd
- 16538 Heatherbrook Ln
- 16767 Heatherbrooke Ln
- 16735 Heatherbrooke Ln
- 16671 Heatherbrooke Ln
- 16672 Heatherbrooke Ln
- Lot 9 Heatherbrooke Ln
- Lot 8 Heatherbrooke Ln
- Lot 4 Heatherbrooke Ln
- 16650 Heatherbrooke Ln
- 14570 Pittsburg Rd
- 16550 Heatherbrook Ln
- 16550 Heatherbrook Ln
- 16561 Heatherbrook Ln
- 16561 Heatherbrook Ln
- 14580 Pittsburg Rd
- 16585 Heatherbrook Ln
- 16574 Heatherbrook Ln
- 14592 Pittsburg Rd
Your Personal Tour Guide
Ask me questions while you tour the home.