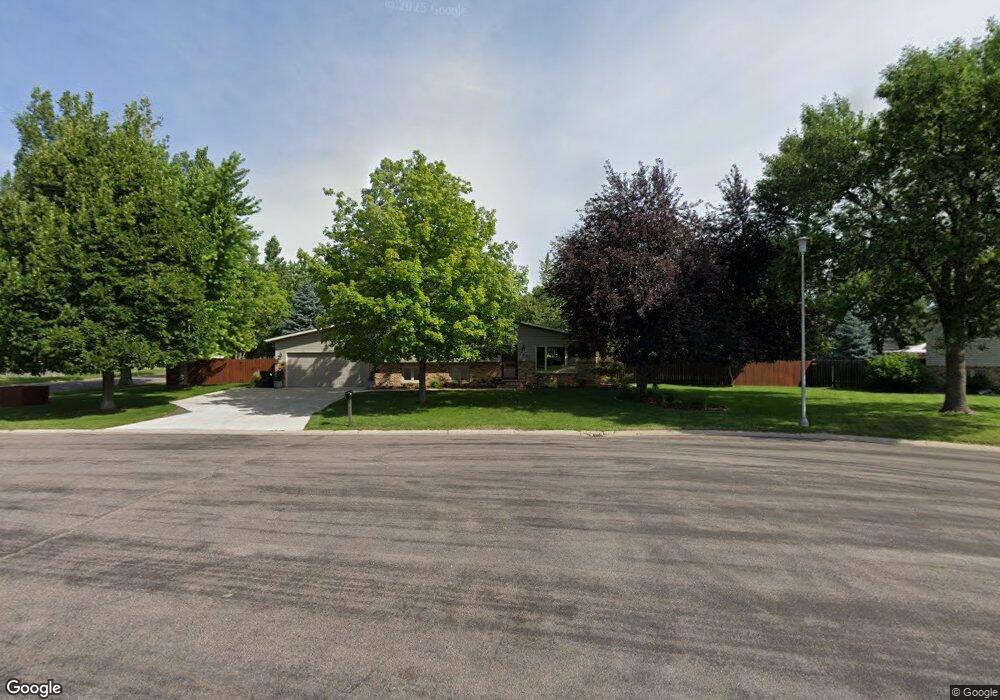
1654 Flickertail Cir S Fargo, ND 58103
South High NeighborhoodEstimated Value: $314,000 - $346,000
4
Beds
2
Baths
2,016
Sq Ft
$163/Sq Ft
Est. Value
About This Home
This home is located at 1654 Flickertail Cir S, Fargo, ND 58103 and is currently estimated at $328,367, approximately $162 per square foot. 1654 Flickertail Cir S is a home located in Cass County with nearby schools including Lewis & Clark Elementary School, Carl Ben Eielson Middle School, and South High School.
Ownership History
Date
Name
Owned For
Owner Type
Purchase Details
Closed on
Mar 1, 2018
Sold by
Klingbeil Seth A and Klingbeil Kayley
Bought by
Sommerfield Breann and Sommerfield Brian
Current Estimated Value
Home Financials for this Owner
Home Financials are based on the most recent Mortgage that was taken out on this home.
Original Mortgage
$233,770
Outstanding Balance
$198,683
Interest Rate
4.04%
Mortgage Type
New Conventional
Estimated Equity
$129,684
Purchase Details
Closed on
May 13, 2014
Sold by
Anderson Cali and Anderson Eric N
Bought by
Klingbeil Seth A and Klingbeil Kayley
Home Financials for this Owner
Home Financials are based on the most recent Mortgage that was taken out on this home.
Original Mortgage
$192,375
Interest Rate
4.34%
Mortgage Type
New Conventional
Purchase Details
Closed on
Mar 1, 2010
Sold by
Anderson Tim
Bought by
Gapp Cali
Purchase Details
Closed on
Dec 17, 2009
Sold by
Schmidt Paul and Schmidt Laura
Bought by
Anderson Tim
Create a Home Valuation Report for This Property
The Home Valuation Report is an in-depth analysis detailing your home's value as well as a comparison with similar homes in the area
Home Values in the Area
Average Home Value in this Area
Purchase History
| Date | Buyer | Sale Price | Title Company |
|---|---|---|---|
| Sommerfield Breann | -- | Title Co | |
| Klingbeil Seth A | $202,500 | None Available | |
| Gapp Cali | $95,000 | -- | |
| Anderson Tim | -- | -- |
Source: Public Records
Mortgage History
| Date | Status | Borrower | Loan Amount |
|---|---|---|---|
| Open | Sommerfield Breann | $233,770 | |
| Previous Owner | Klingbeil Seth A | $192,375 |
Source: Public Records
Tax History Compared to Growth
Tax History
| Year | Tax Paid | Tax Assessment Tax Assessment Total Assessment is a certain percentage of the fair market value that is determined by local assessors to be the total taxable value of land and additions on the property. | Land | Improvement |
|---|---|---|---|---|
| 2024 | $4,451 | $147,950 | $44,000 | $103,950 |
| 2023 | $4,039 | $133,300 | $44,000 | $89,300 |
| 2022 | $3,870 | $124,600 | $44,000 | $80,600 |
| 2021 | $3,729 | $121,600 | $50,100 | $71,500 |
| 2020 | $3,396 | $110,550 | $50,100 | $60,450 |
| 2019 | $3,399 | $110,550 | $31,300 | $79,250 |
| 2018 | $3,358 | $110,550 | $31,300 | $79,250 |
| 2017 | $3,245 | $107,350 | $31,300 | $76,050 |
| 2016 | $2,900 | $104,200 | $31,300 | $72,900 |
| 2015 | $2,734 | $91,100 | $21,300 | $69,800 |
| 2014 | $2,486 | $79,200 | $21,300 | $57,900 |
| 2013 | $2,316 | $79,200 | $21,300 | $57,900 |
Source: Public Records
Map
Nearby Homes
- 1725 Whitestone Cir S
- 2202 15th Ave S
- 2402 N Flickertail Dr S Unit 1
- 1737 Park Blvd S
- 2326 20th Ave S Unit 9
- 2320 20th Ave S Unit 7
- 1407 17th St S
- 1402 E Gateway Cir S Unit M
- 2013 13th Ave S
- 2009 13th Ave S
- 1943 19th St S
- 1545 15th St S
- 2867 Westgate Dr S
- 1709 13th Ave S
- 1129 22nd St S Unit B09
- 1129 22nd St S Unit B12
- 21 Birch Ln S
- 1301 16 1 2 St S
- 1917 16 1 2 St S
- 1718 15th St S
- 1648 Flickertail Cir S
- 1637 23rd St S
- 1631 23rd St S
- 1702 23rd St S
- 2201 17th Ave S
- 1642 Flickertail Cir S
- 1625 23rd St S
- 1632 Flickertail Cir S
- 1701 Whitestone Cir S
- 1701 23rd St S
- 1708 23rd St S
- 2307 17th Ave S
- 1638 Flickertail Cir S
- 1709 Whitestone Cir S
- 2304 S Flickertail Dr S Unit S
- 2201 N Flickertail Dr S Unit S
- 1707 23rd St S
- 2310 S Flickertail Dr S Unit S
- 1714 23rd St S
- 2313 17th Ave S