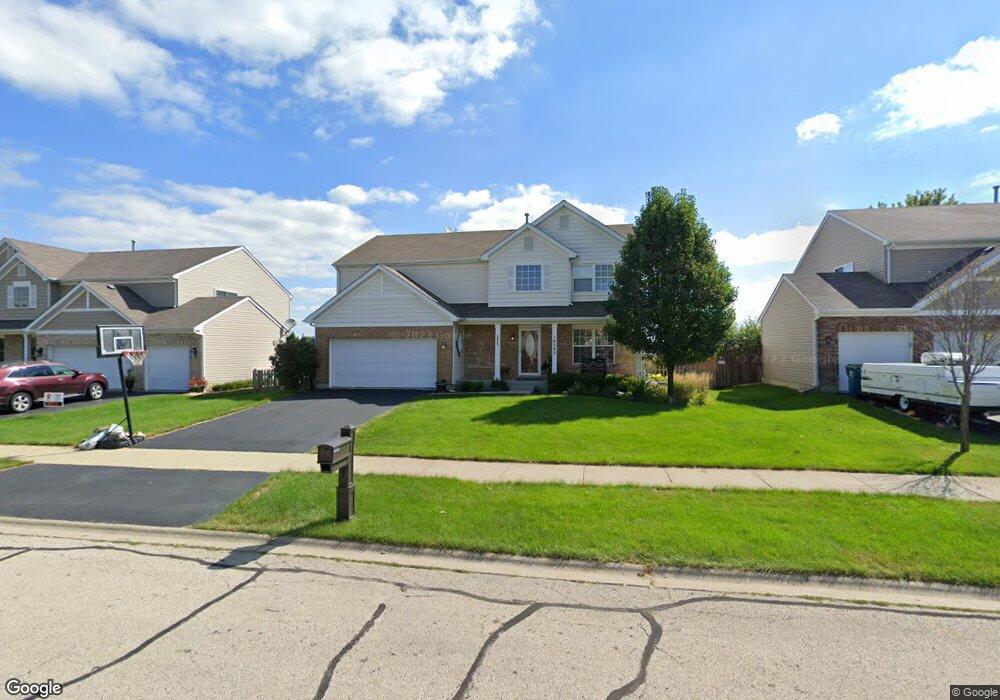
16543 Siegel Dr Unit 1 Crest Hill, IL 60403
Estimated Value: $347,018 - $391,000
3
Beds
3
Baths
2,200
Sq Ft
$165/Sq Ft
Est. Value
About This Home
This home is located at 16543 Siegel Dr Unit 1, Crest Hill, IL 60403 and is currently estimated at $363,005, approximately $165 per square foot. 16543 Siegel Dr Unit 1 is a home located in Will County with nearby schools including Richland Elementary School, Richland Jr High School, and Lockport Township High School East.
Ownership History
Date
Name
Owned For
Owner Type
Purchase Details
Closed on
Aug 23, 2010
Sold by
Federal Home Loan Mortgage Corporation
Bought by
Belvedere Julie A
Current Estimated Value
Home Financials for this Owner
Home Financials are based on the most recent Mortgage that was taken out on this home.
Original Mortgage
$148,006
Interest Rate
4.44%
Mortgage Type
FHA
Purchase Details
Closed on
Apr 27, 2010
Sold by
Giertas Wojciech and Case 09 Ch 01101
Bought by
Federal Home Loan Mortgage Corporation
Purchase Details
Closed on
Feb 3, 2010
Sold by
Giertas Wojciech
Bought by
Jpmorgan Chase Bank National Association
Purchase Details
Closed on
Jan 3, 2006
Sold by
Renaissance Crossing Llc
Bought by
Gieras Wojciech
Home Financials for this Owner
Home Financials are based on the most recent Mortgage that was taken out on this home.
Original Mortgage
$186,800
Interest Rate
5.65%
Mortgage Type
Purchase Money Mortgage
Create a Home Valuation Report for This Property
The Home Valuation Report is an in-depth analysis detailing your home's value as well as a comparison with similar homes in the area
Home Values in the Area
Average Home Value in this Area
Purchase History
| Date | Buyer | Sale Price | Title Company |
|---|---|---|---|
| Belvedere Julie A | $150,000 | Attorneys Title Guaranty Fun | |
| Federal Home Loan Mortgage Corporation | -- | None Available | |
| Jpmorgan Chase Bank National Association | $126,475 | None Available | |
| Gieras Wojciech | $234,000 | None Available |
Source: Public Records
Mortgage History
| Date | Status | Borrower | Loan Amount |
|---|---|---|---|
| Previous Owner | Belvedere Julie A | $148,006 | |
| Previous Owner | Gieras Wojciech | $186,800 |
Source: Public Records
Tax History Compared to Growth
Tax History
| Year | Tax Paid | Tax Assessment Tax Assessment Total Assessment is a certain percentage of the fair market value that is determined by local assessors to be the total taxable value of land and additions on the property. | Land | Improvement |
|---|---|---|---|---|
| 2024 | $7,466 | $100,485 | $24,988 | $75,497 |
| 2023 | $7,466 | $90,210 | $22,433 | $67,777 |
| 2022 | $6,765 | $84,981 | $21,132 | $63,849 |
| 2021 | $6,406 | $79,862 | $19,859 | $60,003 |
| 2020 | $6,232 | $77,236 | $19,206 | $58,030 |
| 2019 | $5,899 | $73,210 | $18,205 | $55,005 |
| 2018 | $5,815 | $70,394 | $17,505 | $52,889 |
| 2017 | $5,501 | $66,453 | $16,525 | $49,928 |
| 2016 | $5,678 | $66,611 | $16,564 | $50,047 |
| 2015 | $5,366 | $63,378 | $15,760 | $47,618 |
| 2014 | $5,366 | $62,135 | $15,451 | $46,684 |
| 2013 | $5,366 | $62,135 | $15,451 | $46,684 |
Source: Public Records
Map
Nearby Homes
- 16613 Buckner Pond Way
- 21201 Lily Lake Ln
- 16415 Grandwood Lake Dr
- 16400 Grandwood Lake Dr
- 21308 Brush Lake Dr
- 21316 Brush Lake Dr
- 16163 Seneca Lake Cir
- 16416 Crescent Lake Ct
- 16400 Crescent Lake Dr
- 17104 Weber Rd
- 16107 Huron St Unit 1
- 21533 Cormorant St
- 21543 Eich Dr
- 16012 Carillon Lakes Ct
- 21368 Carlton St Unit 2
- 21522 Lake st Clair Dr
- 20711 W Renwick Rd
- 21408 Abbey Ln
- 21531 Wolf Lake Way
- 21436 Loch Ln
- 16537 Siegel Dr
- 16531 Siegel Dr
- 16555 Siegel Dr
- 16546 Siegel Dr Unit 1
- 16540 Siegel Dr
- 16534 Siegel Dr
- 16552 Siegel Dr
- 16525 Siegel Dr
- 21007 Siegel Dr
- 16528 Siegel Dr Unit 1
- 16519 Siegel Dr
- 21011 Siegel Dr
- 16547 Zausa Dr
- 16541 Zausa Dr
- 16522 Siegel Dr
- 16553 Zausa Dr
- 16535 Zausa Dr
- 21017 Siegel Dr Unit 1
- 16529 Zausa Dr
- 16513 Siegel Dr