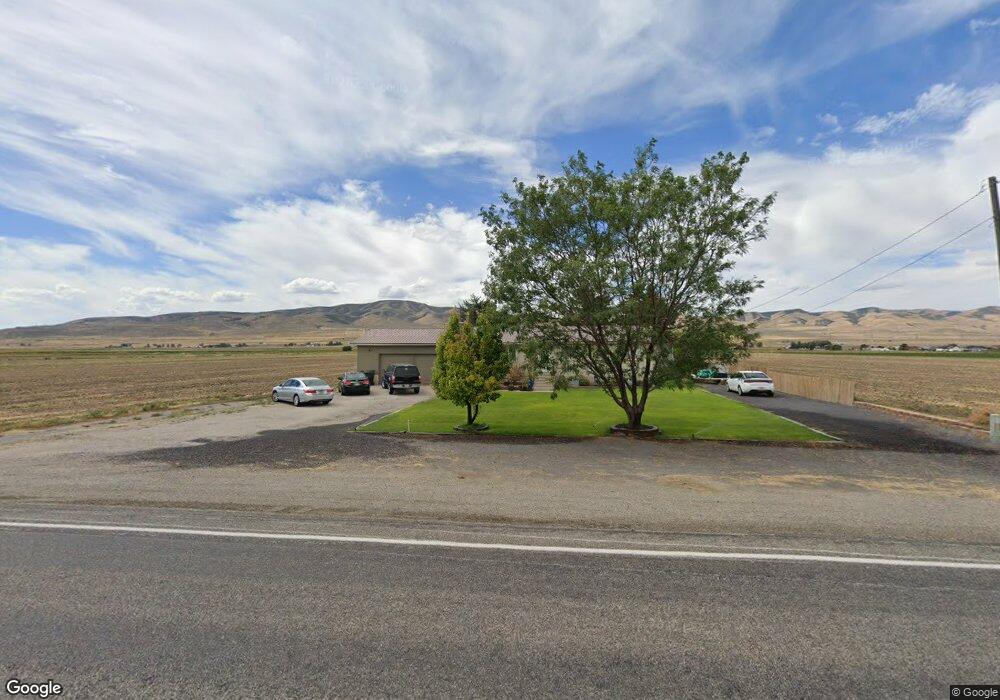
16545 N 5200 W Garland, UT 84312
Estimated Value: $409,000 - $472,000
5
Beds
2
Baths
2,496
Sq Ft
$179/Sq Ft
Est. Value
About This Home
This home is located at 16545 N 5200 W, Garland, UT 84312 and is currently estimated at $447,164, approximately $179 per square foot. 16545 N 5200 W is a home located in Box Elder County with nearby schools including Fielding School, Bear River Middle School, and Alice C. Harris Intermediate School.
Ownership History
Date
Name
Owned For
Owner Type
Purchase Details
Closed on
Feb 15, 2008
Sold by
Slotboom Chambret L
Bought by
Chapman Mark and Chapman Sherin
Current Estimated Value
Home Financials for this Owner
Home Financials are based on the most recent Mortgage that was taken out on this home.
Original Mortgage
$148,840
Outstanding Balance
$91,802
Interest Rate
5.64%
Mortgage Type
VA
Estimated Equity
$355,362
Create a Home Valuation Report for This Property
The Home Valuation Report is an in-depth analysis detailing your home's value as well as a comparison with similar homes in the area
Home Values in the Area
Average Home Value in this Area
Purchase History
| Date | Buyer | Sale Price | Title Company |
|---|---|---|---|
| Chapman Mark | -- | -- |
Source: Public Records
Mortgage History
| Date | Status | Borrower | Loan Amount |
|---|---|---|---|
| Open | Chapman Mark | $148,840 |
Source: Public Records
Tax History Compared to Growth
Tax History
| Year | Tax Paid | Tax Assessment Tax Assessment Total Assessment is a certain percentage of the fair market value that is determined by local assessors to be the total taxable value of land and additions on the property. | Land | Improvement |
|---|---|---|---|---|
| 2025 | $1,585 | $400,041 | $130,000 | $270,041 |
| 2024 | $1,823 | $397,623 | $130,000 | $267,623 |
| 2023 | $1,873 | $413,298 | $130,000 | $283,298 |
| 2022 | $1,838 | $210,014 | $35,750 | $174,264 |
| 2021 | $1,082 | $197,719 | $30,000 | $167,719 |
| 2020 | $1,118 | $197,719 | $30,000 | $167,719 |
| 2019 | $1,005 | $92,262 | $16,500 | $75,762 |
| 2018 | $963 | $84,800 | $16,500 | $68,300 |
| 2017 | $998 | $152,202 | $16,500 | $122,202 |
| 2016 | $955 | $81,663 | $16,500 | $65,163 |
| 2015 | $867 | $75,739 | $16,500 | $59,239 |
| 2014 | $867 | $73,023 | $16,500 | $56,523 |
| 2013 | -- | $68,085 | $16,500 | $51,585 |
Source: Public Records
Map
Nearby Homes
- 16580 N 5200 W
- Berrington Plan at Lookout Mountain
- Stanton Plan at Lookout Mountain
- Cambria Plan at Lookout Mountain
- Brantwood Plan at Lookout Mountain
- Hallwood Plan at Lookout Mountain
- Vanbrough Plan at Lookout Mountain
- Norfolk Plan at Lookout Mountain
- Xavier Plan at Lookout Mountain
- Foxhill Plan at Lookout Mountain
- Knighton Plan at Lookout Mountain
- Winfield Plan at Lookout Mountain
- Edgeworth Plan at Lookout Mountain
- Somerley Plan at Lookout Mountain
- Aldin Plan at Lookout Mountain
- Northfield Plan at Lookout Mountain
- Oakfield Plan at Lookout Mountain
- Denford Plan at Lookout Mountain
- 16115 N 6000 W
- 95 W 100 N