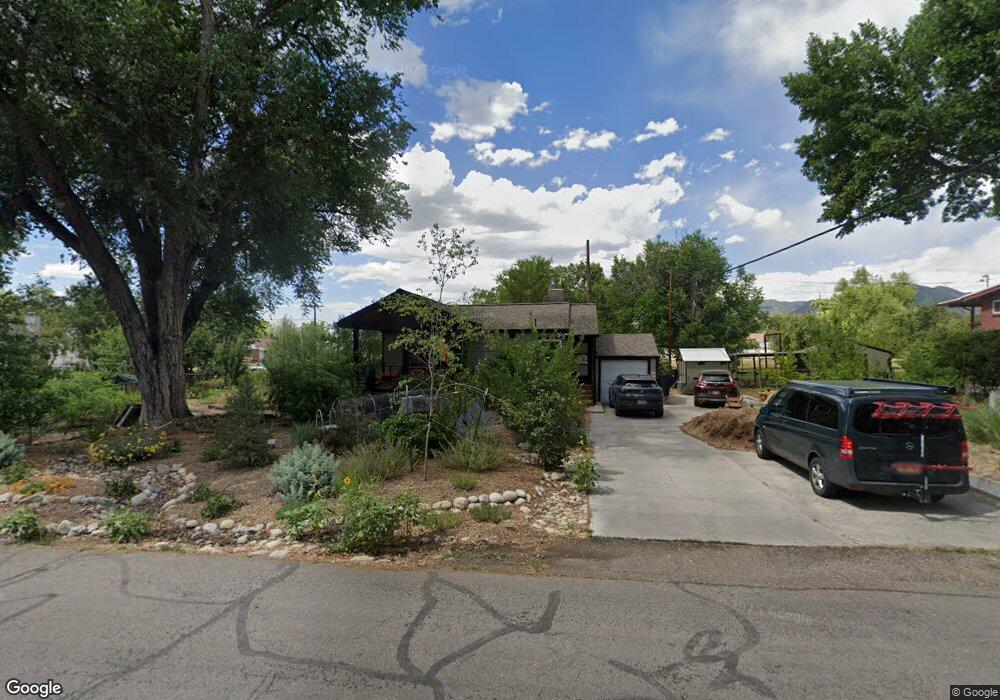
1655 E Atkin Ave Salt Lake City, UT 84106
Sugar House NeighborhoodEstimated Value: $587,000 - $671,000
3
Beds
2
Baths
1,506
Sq Ft
$412/Sq Ft
Est. Value
About This Home
This home is located at 1655 E Atkin Ave, Salt Lake City, UT 84106 and is currently estimated at $621,077, approximately $412 per square foot. 1655 E Atkin Ave is a home located in Salt Lake County with nearby schools including Highland Park Elementary School, Hillside Middle School, and Highland High School.
Ownership History
Date
Name
Owned For
Owner Type
Purchase Details
Closed on
Nov 6, 2023
Sold by
Avery Brian J and Clay Christine A
Bought by
Avery Clay Revocable Trust and Avery
Current Estimated Value
Purchase Details
Closed on
Dec 13, 2019
Sold by
Avery Brian J and Clay Christine A
Bought by
Clay Christine A and Avery Brian J
Home Financials for this Owner
Home Financials are based on the most recent Mortgage that was taken out on this home.
Original Mortgage
$273,000
Interest Rate
3.6%
Mortgage Type
New Conventional
Purchase Details
Closed on
Mar 21, 2017
Sold by
Not Provided
Bought by
Not Provided
Purchase Details
Closed on
Feb 21, 2013
Sold by
Kelly Derek J and Kelly Laura
Bought by
Avery Brian J and Clay Stine A
Home Financials for this Owner
Home Financials are based on the most recent Mortgage that was taken out on this home.
Original Mortgage
$230,400
Interest Rate
3.53%
Mortgage Type
New Conventional
Purchase Details
Closed on
Jul 15, 2005
Sold by
Kelly Derek J
Bought by
Kelly Derek J and Kelly Laura
Home Financials for this Owner
Home Financials are based on the most recent Mortgage that was taken out on this home.
Original Mortgage
$156,000
Interest Rate
5.55%
Mortgage Type
New Conventional
Purchase Details
Closed on
Feb 15, 2001
Sold by
Hosseini Saeid M
Bought by
Edgington Lisa
Purchase Details
Closed on
Jun 11, 1999
Sold by
Hosseini Shahla M
Bought by
Hosseini Saeid M
Purchase Details
Closed on
Jul 15, 1998
Sold by
Hosseini Shahla M and Hosseini Saeid M
Bought by
Hosseini Shahla M
Home Financials for this Owner
Home Financials are based on the most recent Mortgage that was taken out on this home.
Original Mortgage
$123,400
Interest Rate
7%
Purchase Details
Closed on
Jul 1, 1997
Sold by
Hosseini Shahla M
Bought by
Hosseini Shahla M and Hosseini Saeid M
Purchase Details
Closed on
Mar 27, 1997
Sold by
Hosseini Shahla M
Bought by
Hosseini Shahla M
Home Financials for this Owner
Home Financials are based on the most recent Mortgage that was taken out on this home.
Original Mortgage
$123,750
Interest Rate
7.63%
Purchase Details
Closed on
Nov 1, 1996
Sold by
Katoozi Fatemeh
Bought by
Hosseini Shahla M
Purchase Details
Closed on
Aug 28, 1996
Sold by
Acord Robert A and Acord Fay
Bought by
Hosseini Shahla M and Katoozi Fatemeh
Home Financials for this Owner
Home Financials are based on the most recent Mortgage that was taken out on this home.
Original Mortgage
$102,500
Interest Rate
8.23%
Create a Home Valuation Report for This Property
The Home Valuation Report is an in-depth analysis detailing your home's value as well as a comparison with similar homes in the area
Home Values in the Area
Average Home Value in this Area
Purchase History
| Date | Buyer | Sale Price | Title Company |
|---|---|---|---|
| Avery Clay Revocable Trust | -- | None Listed On Document | |
| Clay Christine A | -- | Sutherland Title | |
| Not Provided | -- | None Available | |
| Avery Brian J | -- | Landmark Title | |
| Kelly Derek J | -- | Equity Title | |
| Edgington Lisa | -- | Associated Title | |
| Hosseini Saeid M | -- | Associated Title | |
| Hosseini Shahla M | -- | -- | |
| Hosseini Shahla M | -- | Light Type Company | |
| Hosseini Shahla M | -- | -- | |
| Hosseini Shahla M | -- | -- | |
| Hosseini Shahla M | -- | -- |
Source: Public Records
Mortgage History
| Date | Status | Borrower | Loan Amount |
|---|---|---|---|
| Previous Owner | Clay Christine A | $273,000 | |
| Previous Owner | Avery Brian J | $230,400 | |
| Previous Owner | Kelly Derek J | $156,000 | |
| Previous Owner | Hosseini Shahla M | $123,400 | |
| Previous Owner | Hosseini Shahla M | $123,750 | |
| Previous Owner | Hosseini Shahla M | $102,500 |
Source: Public Records
Tax History Compared to Growth
Tax History
| Year | Tax Paid | Tax Assessment Tax Assessment Total Assessment is a certain percentage of the fair market value that is determined by local assessors to be the total taxable value of land and additions on the property. | Land | Improvement |
|---|---|---|---|---|
| 2025 | $2,684 | $556,400 | $297,100 | $259,300 |
| 2024 | $2,684 | $512,200 | $288,000 | $224,200 |
| 2023 | $2,508 | $461,300 | $228,600 | $232,700 |
| 2022 | $2,727 | $470,600 | $224,100 | $246,500 |
| 2021 | $2,569 | $401,400 | $172,400 | $229,000 |
| 2020 | $2,467 | $366,800 | $162,200 | $204,600 |
| 2019 | $2,244 | $313,900 | $162,200 | $151,700 |
| 2018 | $2,110 | $287,500 | $162,200 | $125,300 |
| 2017 | $2,151 | $274,500 | $155,100 | $119,400 |
| 2016 | $2,137 | $259,000 | $155,100 | $103,900 |
| 2015 | $2,328 | $267,500 | $145,800 | $121,700 |
| 2014 | $2,141 | $244,000 | $135,000 | $109,000 |
Source: Public Records
Map
Nearby Homes
- 2795 S Imperial St
- 2689 S 1700 E
- 1582 E Zenith Ave
- 2719 S Melbourne St
- 2643 S 1700 E
- 1821 Bosham Ln S
- 2692 Wellington St E
- 2649 S 1800 E
- 1621 E 3045 S
- 1930 E Atkin Ave
- 2546 S 1800 E
- 2534 S Imperial St
- 2692 Preston St
- 1839 E Stratford Ave
- 1371 E Zenith Ave
- 2865 S 1335 E
- 1838 E Hillcrest Ave
- 2626 S Preston St
- 1314 E Crandall Ave
- 1865 E Hillcrest Ave
- 1655 Atkin Ave
- 2795 Imperial St Unit 2799
- 1665 Atkin Ave
- 1665 E Atkin Ave
- 2785 Imperial St
- 2785 S Imperial St
- 2815 Imperial St
- 1660 E Atkin Ave
- 1660 Atkin Ave
- 2792 S Imperial St
- 2800 Imperial St
- 2806 Imperial St
- 2806 S Imperial St
- 2765 S Imperial St
- 2792 Imperial St
- 2765 Imperial St
- 1672 Atkin Ave
- 1672 E Atkin Ave
- 2814 Imperial St
- 1675 E Atkin Ave