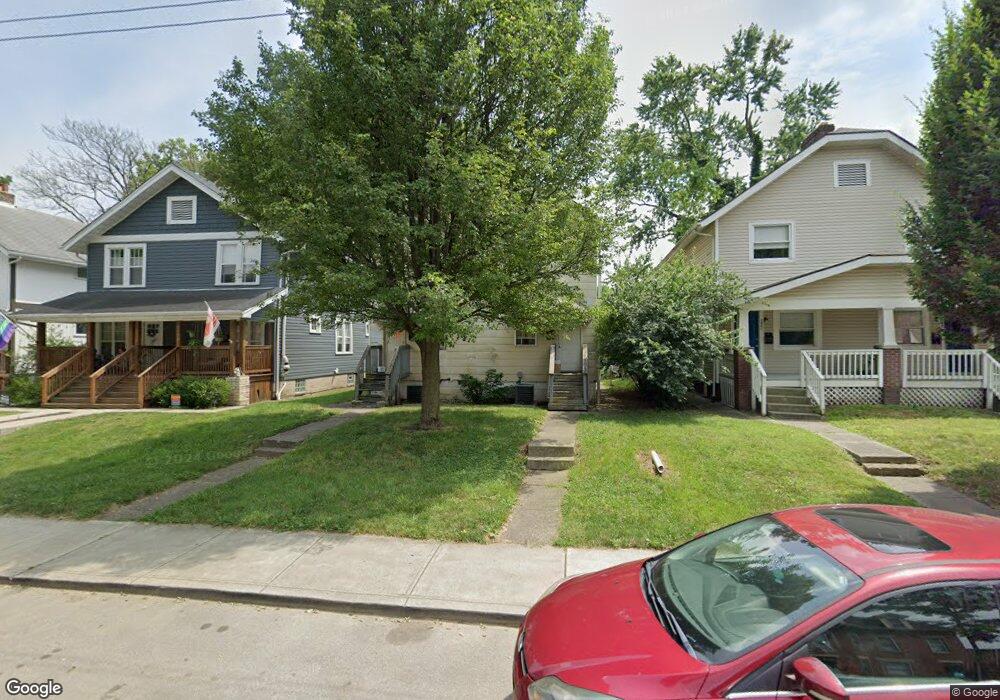
1655 Oak St Unit TWIN Columbus, OH 43205
Franklin Park NeighborhoodEstimated Value: $438,000 - $460,000
4
Beds
3
Baths
1,938
Sq Ft
$229/Sq Ft
Est. Value
About This Home
This home is located at 1655 Oak St Unit TWIN, Columbus, OH 43205 and is currently estimated at $444,321, approximately $229 per square foot. 1655 Oak St Unit TWIN is a home located in Franklin County with nearby schools including Ohio Avenue Elementary School, Champion Middle School, and East High School.
Ownership History
Date
Name
Owned For
Owner Type
Purchase Details
Closed on
Jul 12, 2019
Sold by
Johnson Abner F and Johnson Liat R
Bought by
Krysty Brian M and Adams Amanda J
Current Estimated Value
Home Financials for this Owner
Home Financials are based on the most recent Mortgage that was taken out on this home.
Original Mortgage
$238,500
Outstanding Balance
$208,947
Interest Rate
3.82%
Mortgage Type
New Conventional
Estimated Equity
$235,374
Purchase Details
Closed on
Aug 19, 2015
Sold by
Montenaro Jeffrey Alan and Montenaro Sharon Ann
Bought by
Johnson Abner F and Johnson Liat R
Home Financials for this Owner
Home Financials are based on the most recent Mortgage that was taken out on this home.
Original Mortgage
$230,155
Interest Rate
4.03%
Mortgage Type
VA
Purchase Details
Closed on
Sep 2, 1986
Bought by
Montenaro Jeffrey A
Purchase Details
Closed on
May 1, 1986
Create a Home Valuation Report for This Property
The Home Valuation Report is an in-depth analysis detailing your home's value as well as a comparison with similar homes in the area
Home Values in the Area
Average Home Value in this Area
Purchase History
| Date | Buyer | Sale Price | Title Company |
|---|---|---|---|
| Krysty Brian M | $265,000 | None Available | |
| Johnson Abner F | $229,500 | Title First | |
| Montenaro Jeffrey A | $91,300 | -- | |
| -- | -- | -- |
Source: Public Records
Mortgage History
| Date | Status | Borrower | Loan Amount |
|---|---|---|---|
| Open | Krysty Brian M | $238,500 | |
| Closed | Johnson Abner F | $230,155 |
Source: Public Records
Tax History Compared to Growth
Tax History
| Year | Tax Paid | Tax Assessment Tax Assessment Total Assessment is a certain percentage of the fair market value that is determined by local assessors to be the total taxable value of land and additions on the property. | Land | Improvement |
|---|---|---|---|---|
| 2024 | $8,336 | $135,770 | $37,240 | $98,530 |
| 2023 | $7,971 | $135,765 | $37,240 | $98,525 |
| 2022 | $6,511 | $88,000 | $21,460 | $66,540 |
| 2021 | $6,007 | $88,000 | $21,460 | $66,540 |
| 2020 | $5,786 | $88,000 | $21,460 | $66,540 |
| 2019 | $6,305 | $86,530 | $17,890 | $68,640 |
| 2018 | $5,353 | $86,530 | $17,890 | $68,640 |
| 2017 | $5,290 | $86,530 | $17,890 | $68,640 |
| 2016 | $4,725 | $64,760 | $19,080 | $45,680 |
| 2015 | $4,599 | $64,760 | $19,080 | $45,680 |
| 2014 | $4,597 | $64,760 | $19,080 | $45,680 |
| 2013 | $2,287 | $64,750 | $19,075 | $45,675 |
Source: Public Records
Map
Nearby Homes
- 1669-1671 Oak St
- 1714 Oak St
- 1596 Franklin Ave Unit 598
- 1591 Franklin Ave
- 1692 Bryden Rd
- 1571 Franklin Ave
- 1513 Franklin Ave
- 395-397 Stoddart Ave
- 238-240 Miller Ave
- 266 Miller Ave Unit 268
- 1555 E Rich St Unit 557
- 1833 Franklin Ave
- 1455 Franklin Ave
- 1786 E Rich St Unit 788
- 1825-1827 Bryden Rd
- 356 Miller Ave
- 336 Loeffler Ave
- 362 Loeffler Ave
- 39 Auburn Ave
- 1230 E Main St
- 1659 Oak St Unit TWIN
- 1659 Oak St Unit 661
- 1659 Oak St Unit 1659
- 1659 Oak St Unit 61
- 1659 Oak St
- 1661 Oak St
- 1651 Oak St Unit TWIN
- 1653 Oak St Unit 655
- 1667 Oak St Unit TWIN
- 1649 Oak St Unit 651
- 1663 Oak St Unit TWIN
- 1663 Oak St Unit 665
- 1663 Oak St
- 1645 Oak St
- 1671 Oak St Unit TWIN
- 1643 Oak St Unit 645
- 1643 Oak St
- 1662 Oak St Unit TWIN
- 1669 Oak St Unit 671
- 1670 Oak St Unit TWIN