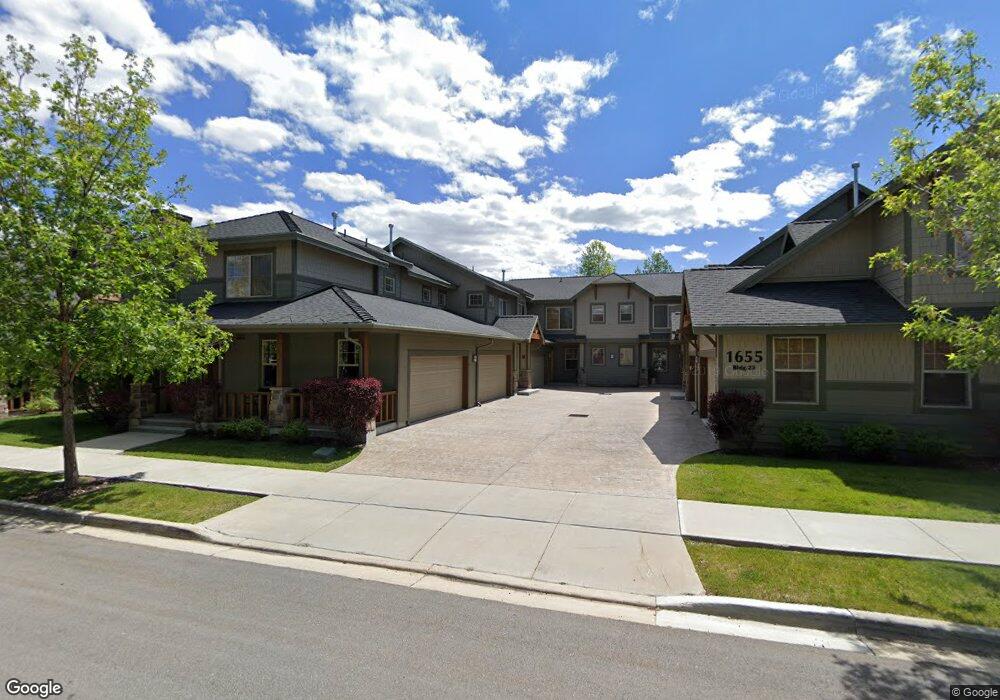
1655 Redstone Ave Unit A2 Park City, UT 84098
Estimated Value: $810,000 - $998,000
2
Beds
3
Baths
1,299
Sq Ft
$701/Sq Ft
Est. Value
About This Home
This home is located at 1655 Redstone Ave Unit A2, Park City, UT 84098 and is currently estimated at $910,833, approximately $701 per square foot. 1655 Redstone Ave Unit A2 is a home located in Summit County with nearby schools including Trailside School, Ecker Hill Middle School, and Treasure Mountain Junior High School.
Ownership History
Date
Name
Owned For
Owner Type
Purchase Details
Closed on
Jan 18, 2021
Sold by
Zhao Shu and The Eli Oren Living Trust
Bought by
Larson Mark and Larson Andrew Robert
Current Estimated Value
Home Financials for this Owner
Home Financials are based on the most recent Mortgage that was taken out on this home.
Original Mortgage
$521,600
Outstanding Balance
$465,037
Interest Rate
2.65%
Mortgage Type
New Conventional
Estimated Equity
$445,796
Purchase Details
Closed on
Oct 2, 2019
Sold by
Oren Eli
Bought by
Oren Eli and Eli Oren Living Trust
Purchase Details
Closed on
Aug 7, 2015
Sold by
Junia Edward X and The Junia Family Trust
Bought by
Oren Eli and Zhao Shu
Home Financials for this Owner
Home Financials are based on the most recent Mortgage that was taken out on this home.
Original Mortgage
$202,500
Interest Rate
3.98%
Mortgage Type
New Conventional
Purchase Details
Closed on
Mar 2, 2012
Sold by
Junia Edward Xavier and Junia Mary Ann
Bought by
Junia Edward X
Create a Home Valuation Report for This Property
The Home Valuation Report is an in-depth analysis detailing your home's value as well as a comparison with similar homes in the area
Home Values in the Area
Average Home Value in this Area
Purchase History
| Date | Buyer | Sale Price | Title Company |
|---|---|---|---|
| Larson Mark | -- | Metro National Title | |
| Oren Eli | -- | None Available | |
| Oren Eli | -- | Stewart Title Ins Co | |
| Junia Edward X | -- | None Available |
Source: Public Records
Mortgage History
| Date | Status | Borrower | Loan Amount |
|---|---|---|---|
| Open | Larson Mark | $521,600 | |
| Previous Owner | Oren Eli | $202,500 |
Source: Public Records
Tax History Compared to Growth
Tax History
| Year | Tax Paid | Tax Assessment Tax Assessment Total Assessment is a certain percentage of the fair market value that is determined by local assessors to be the total taxable value of land and additions on the property. | Land | Improvement |
|---|---|---|---|---|
| 2024 | $2,566 | $457,248 | -- | $457,248 |
| 2023 | $2,566 | $464,393 | $0 | $464,393 |
| 2022 | $2,524 | $404,250 | $0 | $404,250 |
| 2021 | $3,566 | $500,000 | $220,000 | $280,000 |
| 2020 | $3,613 | $480,000 | $220,000 | $260,000 |
| 2019 | $3,759 | $480,000 | $220,000 | $260,000 |
| 2018 | $3,211 | $410,000 | $220,000 | $190,000 |
| 2017 | $2,969 | $410,000 | $220,000 | $190,000 |
| 2016 | $3,037 | $390,000 | $220,000 | $170,000 |
| 2015 | $2,715 | $330,000 | $0 | $0 |
| 2013 | $2,084 | $240,000 | $0 | $0 |
Source: Public Records
Map
Nearby Homes
- 6042 N Fox Pointe Cir Unit C1
- 6020 Park Ln S Unit 70
- 6020 Park Ln S Unit 70
- 6169 Park Ln S Unit 44
- 6169 Park Ln S Unit 60
- 6169 Park Ln S Unit 9
- 6056 Park Ln S Unit 59
- 1456 Newpark Blvd Unit 417
- 1456 Newpark Blvd Unit 213
- 1370 Center Dr Unit 17
- 1370 Center Dr Unit 12
- 5663 Bobsled Blvd
- 6562 Old Forest Dr Unit 14
- 5541 N Slalom Way
- 5519 Lillehammer Ln Unit 1406
- 1339 Fiddich Glen Ln
- 1041 Lincoln Ln
- 5424 Bobsled Blvd Unit T-2
- 6621 Trout Creek Ct
- 8151 Bitner Rd
- 1655 Redstone Ave Unit C2
- 1655 Redstone Ave Unit C1
- 1655 Redstone Ave Unit B2
- 1655 Redstone Ave Unit B1
- 1655 Redstone Ave Unit A1
- 1655 Redstone Ave
- 1655 Redstone Ave Unit 2B
- 1655 W Redstone Ave Unit C1
- 1655 W Redstone Ave Unit A1
- 1655 W Redstone Ave Unit B-2
- 1655 W Redstone Ave Unit A-2
- 1655 W Redstone Ave
- 1655 W Redstone Ave Unit 22
- 1655 W Redstone Ave Unit C2
- 1655 W Redstone Ave Unit B1
- 1655 Redstone Ave Unit B2
- 6195 Fox Pointe Cir Unit C2
- 6195 Fox Pointe Cir Unit C1
- 6195 Fox Pointe Cir Unit B2
- 6195 Fox Pointe Cir Unit B1