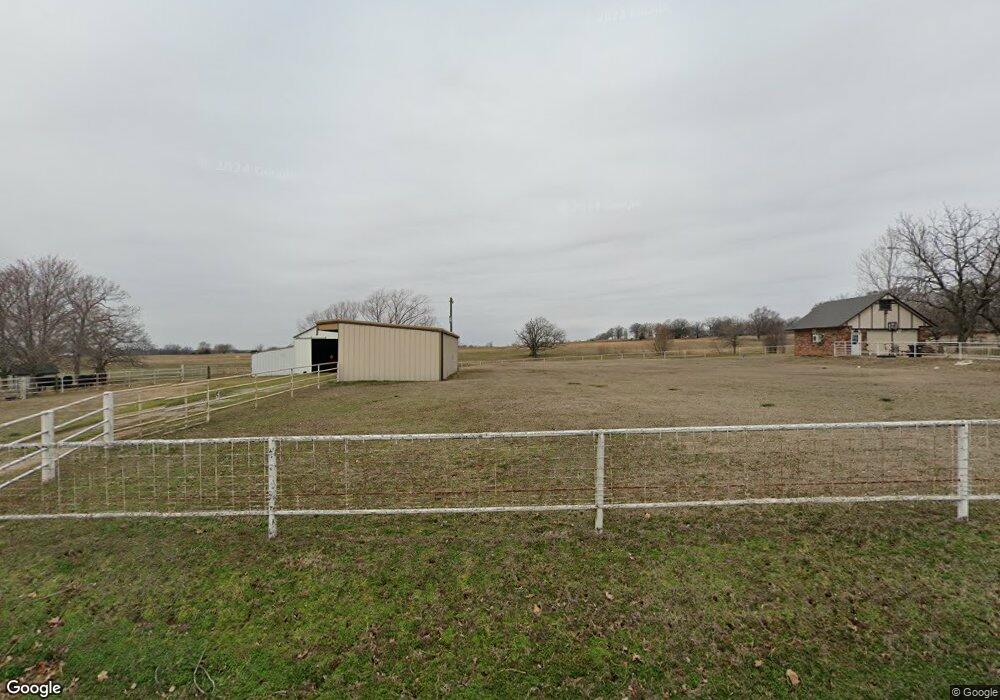
16550 S 4200 Rd Claremore, OK 74017
Estimated Value: $334,000 - $406,099
4
Beds
2
Baths
2,810
Sq Ft
$129/Sq Ft
Est. Value
About This Home
This home is located at 16550 S 4200 Rd, Claremore, OK 74017 and is currently estimated at $363,525, approximately $129 per square foot. 16550 S 4200 Rd is a home located in Rogers County with nearby schools including Sequoyah Elementary School and Sequoyah High School.
Ownership History
Date
Name
Owned For
Owner Type
Purchase Details
Closed on
Oct 9, 2025
Sold by
Purviance Albert R and Purviance Deidre A
Bought by
Purviance Albert R and Purviance Deidre A
Current Estimated Value
Purchase Details
Closed on
Dec 16, 2022
Sold by
Wardell Margaret A
Bought by
Wardell Margaret A and Harren Melanie Carol
Purchase Details
Closed on
Oct 22, 2021
Sold by
Wahle Homes Llc
Bought by
Rogers Danny and Rogers Ann
Home Financials for this Owner
Home Financials are based on the most recent Mortgage that was taken out on this home.
Original Mortgage
$324,022
Interest Rate
3.12%
Mortgage Type
FHA
Purchase Details
Closed on
Jun 11, 2021
Sold by
Peterson Stephan M
Bought by
Wahle Home Llc
Home Financials for this Owner
Home Financials are based on the most recent Mortgage that was taken out on this home.
Original Mortgage
$187,206
Interest Rate
2.9%
Mortgage Type
Future Advance Clause Open End Mortgage
Purchase Details
Closed on
Jun 15, 2012
Sold by
Peterson Stephan M
Bought by
Peterson Everett
Purchase Details
Closed on
Feb 16, 1999
Sold by
Peterson Stephan M
Purchase Details
Closed on
Sep 16, 1992
Sold by
Ward Donald Lee
Create a Home Valuation Report for This Property
The Home Valuation Report is an in-depth analysis detailing your home's value as well as a comparison with similar homes in the area
Home Values in the Area
Average Home Value in this Area
Purchase History
| Date | Buyer | Sale Price | Title Company |
|---|---|---|---|
| Purviance Albert R | -- | None Listed On Document | |
| Wardell Margaret A | -- | Chicago Title | |
| Rogers Danny | $330,000 | Titan Title & Closing Llc | |
| Wahle Home Llc | $58,000 | Apex Ttl & Closing Svcs Llc | |
| Peterson Everett | -- | None Available | |
| -- | -- | -- | |
| -- | $30,000 | -- |
Source: Public Records
Mortgage History
| Date | Status | Borrower | Loan Amount |
|---|---|---|---|
| Previous Owner | Rogers Danny | $324,022 | |
| Previous Owner | Wahle Home Llc | $187,206 |
Source: Public Records
Tax History Compared to Growth
Tax History
| Year | Tax Paid | Tax Assessment Tax Assessment Total Assessment is a certain percentage of the fair market value that is determined by local assessors to be the total taxable value of land and additions on the property. | Land | Improvement |
|---|---|---|---|---|
| 2025 | $3,166 | $32,129 | $5,092 | $27,037 |
| 2024 | $3,090 | $31,192 | $5,092 | $26,100 |
| 2023 | $3,090 | $36,301 | $4,725 | $31,576 |
| 2022 | $3,771 | $36,346 | $4,730 | $31,616 |
| 2021 | $622 | $6,426 | $3,951 | $2,475 |
| 2020 | $614 | $6,021 | $3,306 | $2,715 |
| 2019 | $579 | $5,461 | $2,796 | $2,665 |
| 2018 | $637 | $5,969 | $2,796 | $3,173 |
| 2017 | $629 | $5,940 | $2,796 | $3,144 |
| 2016 | $618 | $5,844 | $2,796 | $3,048 |
| 2015 | $681 | $6,238 | $2,796 | $3,442 |
| 2014 | $671 | $6,152 | $2,494 | $3,658 |
Source: Public Records
Map
Nearby Homes
- 16370 E 450 Rd
- 15671 S 4210 Rd
- 17135 S Creekwood Ct
- 0 4187 Rd Unit 2507470
- 17980 E 430 Rd
- 16881 S 4220 Rd
- 17791 S 4180 Rd
- 14319 S Brendan Blvd
- 0 S 4197 Rd
- 14800 Cedar Dr
- 14397 S 4210 Rd
- 18870 Timberlake
- 14800 S 4220 Rd
- 19616 Helt Rd
- 18723 S 4185 Rd Unit A
- 17090 S 4170 Rd
- 9251 E 470 Rd
- 15334 S 4230 Rd
- 25 E 470 Rd
- 0 S 4220 Rd Unit 2530424
- 16501 S 4200 Rd
- 16450 S 4200 Rd
- 16749 S 4162 Rd
- 16421 S 4200 Rd
- 16390 S 4200 Rd
- 16361 S 4200 Rd
- 16601 E 450 Rd Unit A
- 16601 E 450 Rd
- 16911 S 4200 Rd
- 16302 S 4200 Rd
- 17431 E 450 Rd
- 16915 S 4196 Rd
- 17355 E 450 Rd
- 16463 E 450 Rd
- 17451 E 450 Rd
- 16455 E 450 Rd
- 16752 E 450 Rd
- 6900 NE Akin Rd
- 16404 E 450 Rd
- 16250 S Big Valley Place