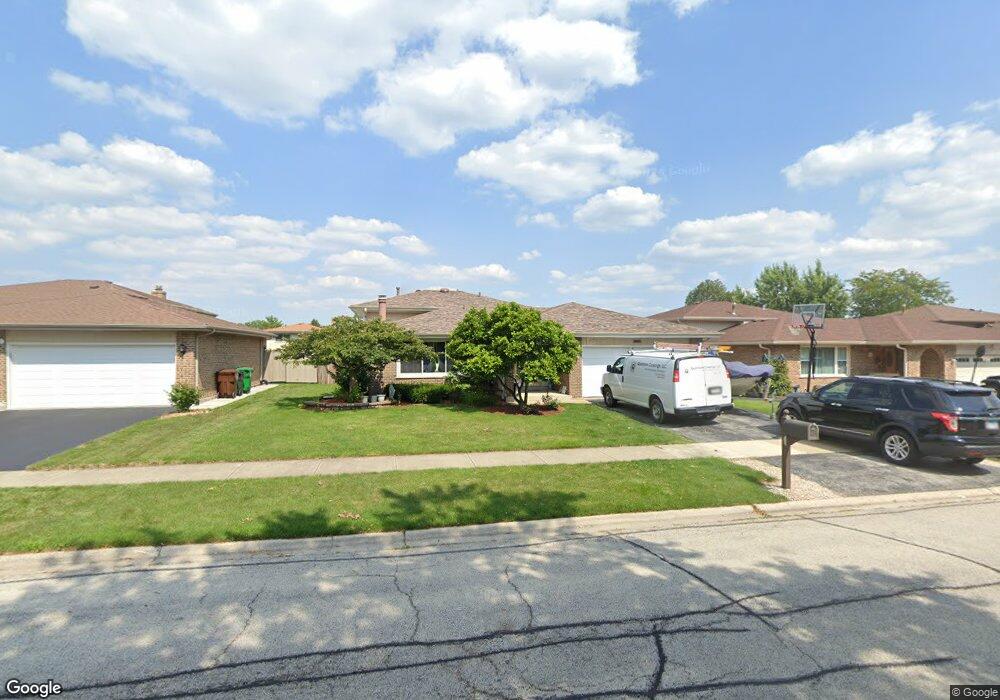
16551 Crescent Ave Tinley Park, IL 60477
Centennial Park NeighborhoodEstimated Value: $380,808 - $439,000
3
Beds
2
Baths
1,590
Sq Ft
$256/Sq Ft
Est. Value
About This Home
This home is located at 16551 Crescent Ave, Tinley Park, IL 60477 and is currently estimated at $406,702, approximately $255 per square foot. 16551 Crescent Ave is a home located in Cook County with nearby schools including Helen Keller Elementary School, Virgil I Grissom Middle School, and Victor J Andrew High School.
Ownership History
Date
Name
Owned For
Owner Type
Purchase Details
Closed on
Sep 19, 2001
Sold by
Laplant Cheryl M
Bought by
Laplant Anthony S and Laplant Cheryl M
Current Estimated Value
Purchase Details
Closed on
Dec 29, 2000
Sold by
Laplant Anthony S
Bought by
Laplant Cheryl M
Purchase Details
Closed on
Dec 7, 1998
Sold by
Williams Peter R and Williams Rose L
Bought by
Laplant Anthony S
Home Financials for this Owner
Home Financials are based on the most recent Mortgage that was taken out on this home.
Original Mortgage
$148,750
Outstanding Balance
$34,314
Interest Rate
6.96%
Estimated Equity
$372,388
Create a Home Valuation Report for This Property
The Home Valuation Report is an in-depth analysis detailing your home's value as well as a comparison with similar homes in the area
Home Values in the Area
Average Home Value in this Area
Purchase History
| Date | Buyer | Sale Price | Title Company |
|---|---|---|---|
| Laplant Anthony S | -- | -- | |
| Laplant Cheryl M | -- | -- | |
| Laplant Anthony S | $165,500 | -- |
Source: Public Records
Mortgage History
| Date | Status | Borrower | Loan Amount |
|---|---|---|---|
| Open | Laplant Anthony S | $148,750 |
Source: Public Records
Tax History Compared to Growth
Tax History
| Year | Tax Paid | Tax Assessment Tax Assessment Total Assessment is a certain percentage of the fair market value that is determined by local assessors to be the total taxable value of land and additions on the property. | Land | Improvement |
|---|---|---|---|---|
| 2024 | $7,964 | $32,000 | $4,875 | $27,125 |
| 2023 | $6,125 | $32,000 | $4,875 | $27,125 |
| 2022 | $6,125 | $20,601 | $3,453 | $17,148 |
| 2021 | $5,959 | $20,600 | $3,453 | $17,147 |
| 2020 | $5,880 | $20,600 | $3,453 | $17,147 |
| 2019 | $6,426 | $23,243 | $3,046 | $20,197 |
| 2018 | $6,286 | $23,243 | $3,046 | $20,197 |
| 2017 | $6,138 | $23,243 | $3,046 | $20,197 |
| 2016 | $6,582 | $22,316 | $2,843 | $19,473 |
| 2015 | $6,470 | $22,316 | $2,843 | $19,473 |
| 2014 | $6,433 | $22,316 | $2,843 | $19,473 |
| 2013 | $6,419 | $23,883 | $2,843 | $21,040 |
Source: Public Records
Map
Nearby Homes
- 7914 164th Ct Unit 262
- 16666 Parliament Ave
- 7810 166th Place
- 16413 Prairie Dr
- 16705 Paxton Ave
- 7727 166th St
- 16742 Paxton Ave Unit 2S
- 7938 Paxton Ave Unit 3E
- 7914 163rd Place Unit 143
- 8106 168th Place Unit 3W
- 7913 Paxton Ave Unit 1W
- 7925 Paxton Ave Unit 1A
- 8118 168th Place
- 8136 168th Place Unit 3E
- 16531 76th Ave
- 16500 76th Ave
- 16401 Tanbark Dr
- 16212 Hamilton Ave
- 16218 Princeton Ave
- 16207 Hamilton Ave
- 16557 Crescent Ave
- 16545 Crescent Ave
- 16550 Parkview Ave
- 16563 Crescent Ave
- 16539 Crescent Ave
- 16556 Parkview Ave
- 16538 Parkview Ave
- 16562 Parkview Ave
- 16552 Crescent Ave Unit 3
- 16603 Crescent Ave
- 16533 Crescent Ave
- 16558 Crescent Ave Unit 1
- 16558 Crescent Ave
- 16540 Crescent Ave Unit B
- 16540 Crescent Ave Unit C
- 16540 Crescent Ave Unit A
- 16540 Crescent Ave Unit 3
- 16540 Crescent Ave
- 16532 Parkview Ave
- 16602 Parkview Ave