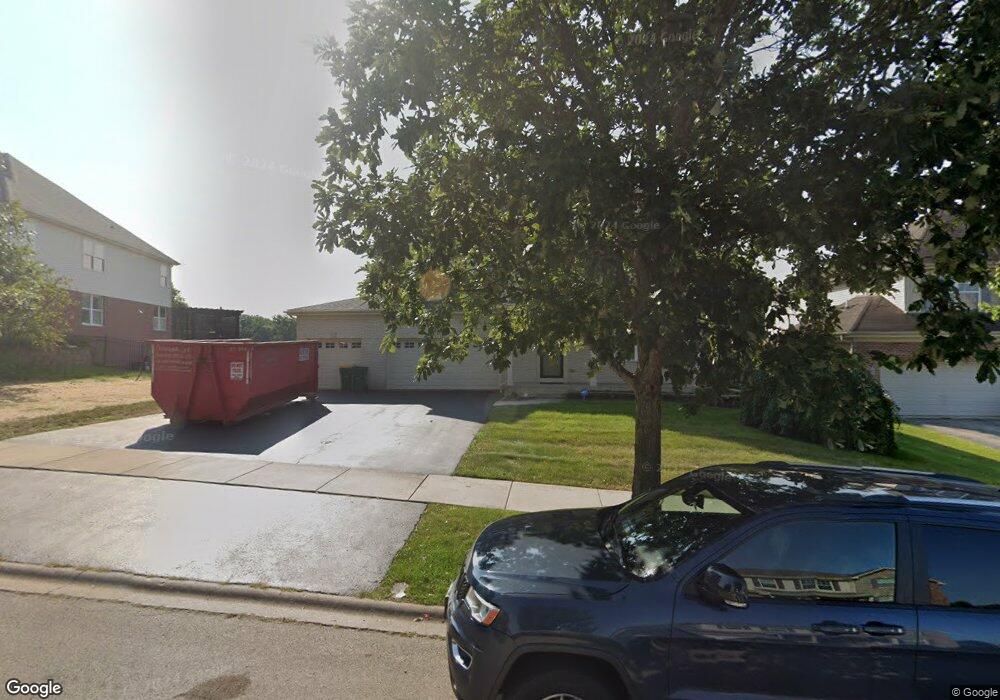
16551 McKenzie Avelot19 Lockport, IL 60441
Estimated Value: $548,000 - $681,278
4
Beds
3
Baths
2,661
Sq Ft
$238/Sq Ft
Est. Value
About This Home
This home is located at 16551 McKenzie Avelot19, Lockport, IL 60441 and is currently estimated at $634,320, approximately $238 per square foot. 16551 McKenzie Avelot19 is a home located in Will County with nearby schools including Walsh Elementary School, Ludwig Elementary School, and Reed Elementary School.
Ownership History
Date
Name
Owned For
Owner Type
Purchase Details
Closed on
Oct 27, 2020
Sold by
Trust Number 14440 and West Suburban Bank
Bought by
Morgan John and Morgan Sheena
Current Estimated Value
Home Financials for this Owner
Home Financials are based on the most recent Mortgage that was taken out on this home.
Original Mortgage
$388,550
Interest Rate
2.75%
Mortgage Type
New Conventional
Purchase Details
Closed on
Mar 22, 2019
Sold by
Burns Ronald
Bought by
West Surban Bank
Purchase Details
Closed on
Mar 28, 2007
Sold by
William Ryan Homes Inc
Bought by
Burns Ronald L and Burns Madonna J
Home Financials for this Owner
Home Financials are based on the most recent Mortgage that was taken out on this home.
Original Mortgage
$341,940
Interest Rate
6.37%
Mortgage Type
Purchase Money Mortgage
Create a Home Valuation Report for This Property
The Home Valuation Report is an in-depth analysis detailing your home's value as well as a comparison with similar homes in the area
Home Values in the Area
Average Home Value in this Area
Purchase History
| Date | Buyer | Sale Price | Title Company |
|---|---|---|---|
| Morgan John | $409,000 | None Listed On Document | |
| West Surban Bank | -- | Attorney | |
| Burns Ronald L | $456,000 | Ticor Title |
Source: Public Records
Mortgage History
| Date | Status | Borrower | Loan Amount |
|---|---|---|---|
| Previous Owner | Morgan John | $388,550 | |
| Previous Owner | Burns Ronald L | $341,940 |
Source: Public Records
Tax History Compared to Growth
Tax History
| Year | Tax Paid | Tax Assessment Tax Assessment Total Assessment is a certain percentage of the fair market value that is determined by local assessors to be the total taxable value of land and additions on the property. | Land | Improvement |
|---|---|---|---|---|
| 2024 | $13,302 | $171,230 | $30,761 | $140,469 |
| 2023 | $13,302 | $155,212 | $27,883 | $127,329 |
| 2022 | $11,987 | $144,923 | $26,035 | $118,888 |
| 2021 | $10,986 | $137,303 | $24,666 | $112,637 |
| 2020 | $10,908 | $132,251 | $23,758 | $108,493 |
| 2019 | $11,005 | $127,225 | $22,855 | $104,370 |
| 2018 | $10,756 | $122,761 | $22,593 | $100,168 |
| 2017 | $10,563 | $119,325 | $21,961 | $97,364 |
| 2016 | $10,346 | $115,346 | $21,229 | $94,117 |
| 2015 | $10,757 | $111,016 | $20,432 | $90,584 |
| 2014 | $10,757 | $115,015 | $20,010 | $95,005 |
| 2013 | $10,757 | $115,015 | $20,010 | $95,005 |
Source: Public Records
Map
Nearby Homes
- 16609 W Saddlewood Dr
- 9.5 Acres S Archer Ave
- 15303 S Oak Run Ct
- 1220 E Wellwood Dr
- 1012 N Glenmore St
- 317 Bonnie Dr
- 15532 S Gougar Rd
- 1024 Kylemore Ct
- 721 Reef Rd
- 1102 E Treeline Dr
- 16431 W Golden Valley Ln
- 16433 W Golden Valley Ln
- 14743 S Hillside Dr
- 14741 S Hillside Dr
- 0 Smith Rd South of 135th St Unit MRD12274096
- 0 151st & MacGregor St Unit MRD11873272
- 0 N State St Unit 10995892
- 808 Cove Ave
- 16507 Golden Valley Ln
- 1105 Shoals Dr
- 16551 W Mckenzie Ave
- 16545 W Mckenzie Ave
- 16557 W Mckenzie Ave
- 16541 W Mckenzie Ave
- 16561 W Mckenzie Ave
- 16544 W Mckenzie Ave
- 16554 W Mckenzie Ave
- 16540 S Red Bud Ln
- 16539 W Mckenzie Ave
- 16540 W Mckenzie Ave Unit 51
- 16540 W Mckenzie Ave
- 16565 W Mckenzie Ave
- 16540 W Mckenzie Ave
- 16540 McKenzie Lot 51 Dr
- 15636 S Red Bud Ln
- 16537 W Mckenzie Ave
- 15630 S Red Bud Ln
- 15617 S Red Bud Ln
- 16536 W Mckenzie Ave
- 15630 Red Bud Ln