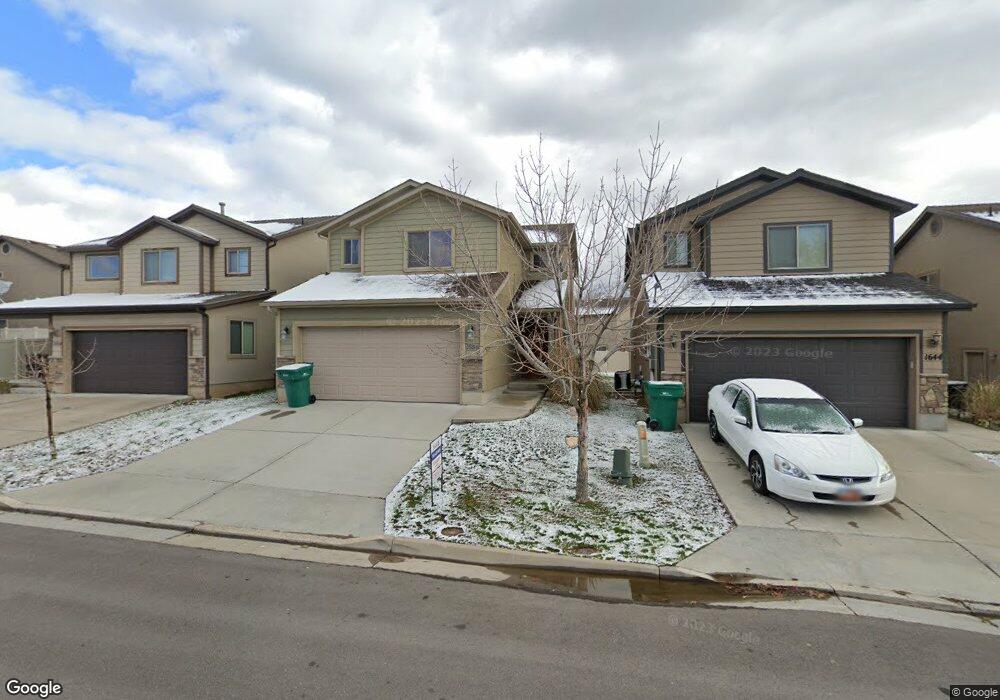
Special security deposit offer: Pay just 50% of your base rent as your security deposit (taxes and fees not included), valid for new applicants who sign a 12-month lease by February 28, 2026. Offer is contingent on application approval and execution of a lease agreement. Other terms and conditions may apply. This property is professionally managed by American Homes 4 Rent, a leading single-family rental company. We work to simplify your rental experience by offering self-guided tours and a streamlined leasing process you can complete all online, all on your own schedule. Once moved in, we provide maintenance support that you can rely on, so you can enjoy your weekends stress-free. We look forward to welcoming you home! See Today, Sign Today™ Take a self-guided tour of this property using our Let Yourself In® service to view the space on your own schedule, without an agent. And if your documents are in order, you might even view a home and sign a lease on the same day! Utilities, taxes, and other fees may apply. Please verify and confirm all information before signing a lease. If you have questions, don’t hesitate to contact us at the telephone number on this property listing. All lease applications, documentation, and initial payments for this property, must be submitted directly through or by phone. The photos, renderings, or other images of the properties on our website, are for illustrative purposes only, and may vary from the features, amenities, or phase of construction. We do not advertise properties on Craigslist, Facebook Marketplace, or other classified advertising websites. If you believe one of our residences is listed there, please notify us. For further description of applicable fees, please go to our website.